Debugger Overview
The integrated debugger allows to run a program step-by-step and examine the memory and register contents.
The debugger includes a very simple SIO emulation that allows to send output and read input using the dedicated debugger terminal window. The program do not need to initialize the SIO chip for that.
To activate the editor click on the  icon on the toolbar.
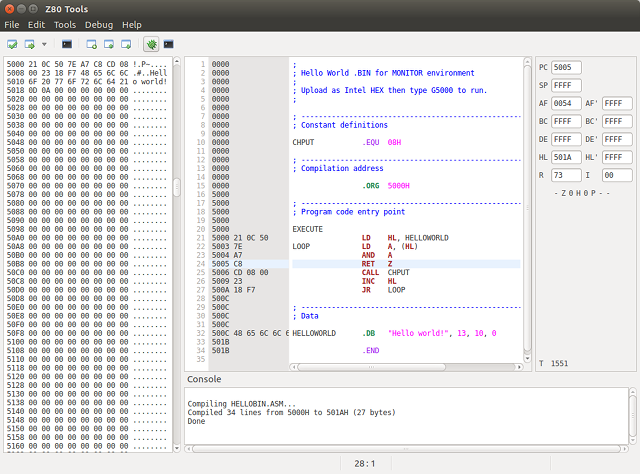
Memory
The left side shows the hexadecimal and ASCII dump of the emulated Z80 processor memory.
The view is currently read-only. When the code writes to a memory location, the content is highlighted.
Listing
The center side shows the listing of the compiled source, along with the instructions and data code.
The view is read-only, the source file can't be edited.
Registers
The right side shows the contents of the Z80 registers and flags.
Console
The console view at the bottom shows the compiler output and the emulated serial port outputs, if the debugger terminal window is not open, otherwise only the SIO port B output is shown. Input from the console view is not supported.
Debugger Terminal
The debugger terminal window shows the output sent to the emulated SIO port A, located at I/O addresses 80H/81H, and can be used
to send data to the program under debug. To open the debugger terminal, click on the  icon, near the bug icon, on the toolbar.
The output of the emulated SIO port B, located at addresses 82H/83H, is always sent to the console view. Input from that port is not supported.