|
|
||
|---|---|---|
| drivers | ||
| extras | ||
| gui | ||
| images | ||
| setup_examples | ||
| .gitignore | ||
| ADAFRUIT.md | ||
| ASYNC.md | ||
| DISPLAYS.md | ||
| DRIVERS.md | ||
| FPLOT.md | ||
| IMAGE_DISPLAY.md | ||
| LICENSE | ||
| README.md | ||
| img_cvt.py | ||
| package.json | ||
README.md
MicroPython nano-gui
A lightweight and minimal MicroPython GUI library for display drivers based on
the FrameBuffer class. It is portable between a range of MicroPython hosts
and display devices. Various display technologies are supported, including
small color and monochrome OLED's, color TFT's, ePaper and Sharp units.
The nano-gui library is display-only. A library supporting user input is
micro-gui; this comes at
a cost of a substantially greater RAM requirement. It supports all displays
available to nano-gui.
These images, most from OLED displays, fail to reproduce the quality of these
displays. OLEDs are visually impressive displays with bright colors, wide
viewing angle and extreme contrast. For some reason I find them hard to
photograph.
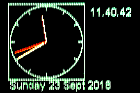 The aclock.py demo.
 Label objects in two fonts.
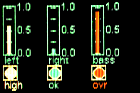 One of the demos running on an Adafruit 1.27 inch
OLED. The colors change dynamically with low values showing green, intermediate
yellow and high red.
One of the demos running on an Adafruit 1.27 inch
OLED. The colors change dynamically with low values showing green, intermediate
yellow and high red.
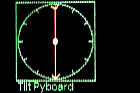 The alevel.py demo. The Pyboard was mounted
vertically: the length and angle of the vector arrow varies as the
Pyboard is moved.
The alevel.py demo. The Pyboard was mounted
vertically: the length and angle of the vector arrow varies as the
Pyboard is moved.
There is an optional graph plotting module for basic Cartesian and polar plots, also real time plotting including time series.
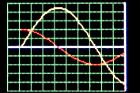 A sample image from the plot module.
These images from a TFT display illustrate the new widgets.
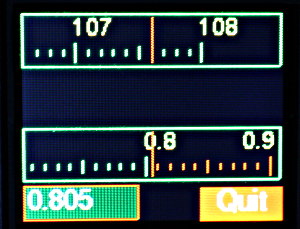 The Scale widget. Capable of precision display of
floats as the notionally very long scale moves behind its small window.
The Scale widget. Capable of precision display of
floats as the notionally very long scale moves behind its small window.
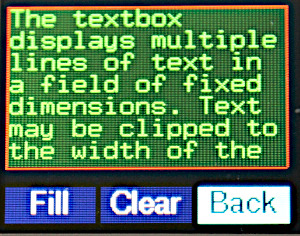 The Textbox widget for scrolling text with word
wrap or clipping.
The Textbox widget for scrolling text with word
wrap or clipping.
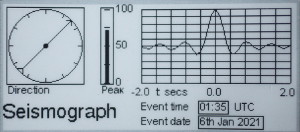 A mockup of a seismograph screen on an ePaper
display.
A mockup of a seismograph screen on an ePaper
display.
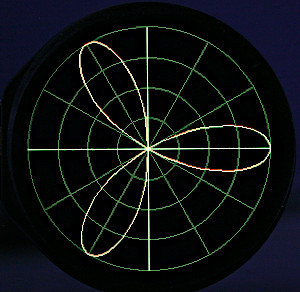 Circular display using gc9a01 controller.
Contents
- Introduction
1.1 Change log
1.2 Description
1.3 Quick start Run without actually installing it.
1.3.1 Quick install
1.4 A performance boost - Files and Dependencies
2.1 Files
2.1.1 Core files
2.1.2 Demo Scripts
2.1.3 Fonts
2.1.4 Hardware setup examples
2.2 Dependencies
2.3 Verifying hardware configuration - The nanogui module
3.1 Application Initialisation Initial setup and refresh method.
3.1.1 User defined colors
3.1.2 Monochrome displays A slight "gotcha" with ePaper.
3.1.3 Display update mechanism How updates are managed.
3.1.4 ePaper displays New developments in ePaper.
3.2 Label class Dynamic text at any screen location.
3.3 Meter class A vertical panel meter.
3.4 LED class Virtual LED of any color.
3.5 Dial and Pointer classes Clock or compass style display of one or more pointers.
3.6 Scale class Linear display with wide dynamic range.
3.7 Class Textbox Scrolling text display. - ESP8266 This can work. Contains information on
minimising the RAM and flash footprints of the GUI.
Appendix 1 Freezing bytecode Optional way to save RAM.
Appendix 2 Round displays Alternative hardware check script.
Supported displays
Device driver document.
Graph plotting module.
The extras directory.
The extras directory contains further widgets back-ported from
micro-gui plus further
demos and information. The aim is to avoid this document becoming over long and
daunting to new users.
1. Introduction
This library provides a limited set of GUI objects (widgets) for displays whose
display driver is subclassed from the FrameBuffer class. The drivers can have
minimal code as graphics primitives are supplied by the FrameBuffer class.
Compatible and tested displays are detailed here. The device driver doc provides guidance on selecting the right driver for your display, platform and application.
The GUI is cross-platform. The device driver doc explains how to configure it for a given display and MicroPython host by adapting a single small file. The GUI supports multiple displays attached to a single target, but bear in mind the RAM requirements for multiple frame buffers. The GUI has been tested on Pyboard 1.1, Pyboard D, Raspberry Pi Pico and on the ESP32 reference board without SPIRAM. Running on ESP8266 is possible but frozen bytecode must be used owing to its restricted RAM - see Appendix 1 Freezing bytecode.
It uses synchronous code but is compatible with asyncio. Some demo programs
illustrate this. Code is standard MicroPython, but some device drivers use the
native and viper decorators.
The GUI is display-only and lacks provision for user input. Authors of applications requiring touch should consider the touch GUI's for the following displays:
For historical reasons and to ensure consistency, code and documentation for
my GUI's employ the American spelling of color.
1.1 Change log
22 May 2024 Support circular displays with gc9a01 controller.
15 Mar 2023 Driver update to 4.2 inch Waveshare ePpaper display.
12 Feb 2023 Add support for sh1106 driver. Fix color compatibility of SSD1306.
5 Sep 2022 Add support for additional Pico displays.
8 Aug 2022 Typo and grammar fixes from @bfiics.
10 May 2022 Support Waveshare Pi Pico displays.
7 Sep 2021 Code reduction and faster color text display. Color use now requires
firmware V1.17 or later.
26 Aug 2021 Support PR7682
for fast text rendering.
25 Apr 2021 Support TTGO T-Display.
26 Mar 2021 Add ST7789. Alter asyncio support on ili9341.
1.2 Description
Widgets are intended for the display of data from physical devices such as sensors. They are drawn using graphics primitives rather than icons to minimise RAM usage. It also enables them to be efficiently rendered at arbitrary scale by hosts with restricted processing power. The approach also enables widgets to maximise information in ways that are difficult with icons, in particular using dynamic color changes in conjunction with moving elements.
Copying the contents of the frame buffer to the display is relatively slow. The time depends on the size of the frame buffer and the interface speed, but the latency may be too high for applications such as games. For example the time to update a 128x128x8 color ssd1351 display on a Pyboard 1.0 is 41ms.
Drivers based on FrameBuffer must allocate contiguous RAM for the buffer. To
avoid 'out of memory' errors it is best to instantiate the display before
importing other modules. The example color_setup files illustrate this.
1.3 Quick start
An easy way to start is to use mpremote which allows a directory on your PC
to be mounted on the host. In this way the filesystem on the host is left
unchanged. This is at some cost in loading speed, especially on ESP32. If
adopting this approach, you will need to edit the color_setup.py file on
your PC to match your hardware. Install mpremote with:
$ pip3 install mpremote
Clone the repo to your PC with:
$ git clone https://github.com/peterhinch/micropython-nano-gui
$ cd micropython-nano-gui
As supplied, color_setup.py assumes a Pyboard (1.x or D) connected to an
Adafruit 1.27" OLED as specified in that file. If that doesn't correspond to
your hardware, it should be edited to suit. See example files in the
setup_examples directory.
$ mpremote mount .
This should provide a REPL. Run a demo:
>>> import gui.demos.aclock
The directory setup_examples has examples of files to match various displays
and targets. If one of these matches your hardware, it may be copied to the
root as color_setup.py.
Note that the gui.demos.aclock.py demo comprises 38 lines of actual code.
This stuff is easier than you might think.
1.3.1 Quick install
On networked hardware this is done with mip which is included in recent
firmware. On non-networked hardware this is done using the official
mpremote utility
which should be installed on the PC as described above.
Networked hardware
The easy approach is to copy the entire GUI to your hardware using mip
>>> import mip
>>> mip.install("github:peterhinch/micropython-nano-gui")
Substantial pruning can be done to eliminate unused fonts, widgets and demos. The appropriate driver for the display hardware is installed as follows (example is for ST7789):
>>> mip.install("github:peterhinch/micropython-nano-gui/drivers/st7789")
The last part of the addresss (st7789) is the name of the directory holding
drivers for the display in use.
After editing color_setup.py as discussed above it should be copied to the
target hardware with:
$ mpremote cp color_setup.py :
Non networked hardware
Installation is as per networked hardware except that mip on the target is
replaced by mpremote mip on the PC:
$ mpremote mip install "github:peterhinch/micropython-nano-gui"
$ mpremote mip install "github:peterhinch/micropython-nano-gui/drivers/st7789"
1.4 A performance boost
Use of color displays now requires firmware V1.17 or later which offered a
performance boost. If upgrading nano-gui from an installation which pre-dated
V1.17 the display driver and GUI core files should be updated and the new file
drivers/boolpalette.py must exist.
Contents
2. Files and Dependencies
On monochrome displays firmware should be V1.13 or later. On the Pi Pico firmware should be V1.15 or later. For color displays it should be V1.17 or later.
Installation comprises copying the gui and drivers directories, with their
contents, plus a hardware configuration file, to the target. The directory
structure on the target must match that in the repo. This consumes about 300KiB
of flash.
Filesystem space may be conserved by copying only the required driver from
drivers, but the directory path to that file must be retained. For example,
for SSD1351 displays only the following are actually required:
drivers/ssd1351/ssd1351.py, drivers/ssd1351/__init__.py.
The small color_setup.py file contains all hardware definitions (for color or
monochrome displays). This is the only file which will require editing to match
the display and its wiring. For information on how to do this, see
the drivers document.
2.1 Files
2.1.1 Core files
The root directory contains an example setup file color_setup.py for a color
OLED display. Other examples may be found in the setup_examples directory.
These are templates for adaptation: only one file is copied to the target. On
the target the file should be named color_setup.py and put in the root of the
filesystem.
The chosen template will need to be edited to match the display in use, the MicroPython target and the electrical connections between display and target. Electrical connections are detailed in the template source.
color_setup.pyHardware setup for the display. As written supports an SSD1351 display connected to a Pyboard.
The gui/core directory contains the GUI core and its principal dependencies:
nanogui.pyThe library.writer.pyModule for rendering Python fonts.fplot.pyThe graph plotting module.colors.pyColor constants.
Contents
2.1.2 Demo scripts
The gui/demos directory contains test/demo scripts.
Demos for small displays:
mono_test.pyTests/demos using the official SSD1306 or SH1106 driver for monochrome 128*64 OLED displays.color96.pyTests/demos for the Adafruit 0.96 inch color OLED.
Demos for larger displays.
color15.pyDemonstrates a variety of widgets. Cross platform.aclock.pyAnalog clock demo. Cross platform.alevel.pySpirit level using Pyboard accelerometer.fpt.pyPlot demo. Cross platform.scale.pyA demo of theScalewidget. Cross platform. Usesasyncio.asnano_sync.pyTwo Pyboard specific demos using the GUI withasyncio.asnano.pyCould readily be adapted for other targets.tbox.pyDemoTextboxclass. Cross-platform.round.pyDemo for 240*240 circular displays.
Demos for ePaper displays:
epd_async.pyDemo of asynchronous code on an eInk display. Needs a large display.epd29_sync.pyDemo for Adafruit 2.9" eInk display: emulates a seismograph.epd29_async.pyAsynchronous demo for Adafruit 2.9" eInk display.epd29_lowpower.pyMicropower demo for Adafruit 2.9" eInk display. This doc Micropower use should be read before attempting to run this.
Demos for Sharp displays:
sharptest.pyBasic functionality check.clocktest.pyDigital and analog clock demo.clock_batt.pyLow power demo of battery operated clock.
Usage with asyncio is discussed here. In summary the GUI works
well with asyncio but the blocking which occurs during transfer of the
framebuffer to the display may affect more demanding applications. Some display
drivers have an additional asynchronous refresh method. This may optionally be
used to mitigate the resultant latency.
Contents
2.1.3 Fonts
Python font files are in the gui/fonts directory. The easiest way to conserve
RAM is to freeze them which is highly recommended. In doing so the directory
structure must be maintained: the ESP8266 provides an
illustration.
To create alternatives, Python fonts may be generated from industry standard
font files with
font_to_py.py. The
-x option for horizontal mapping must be specified. If fixed pitch rendering
is required -f is also required. Supplied examples are:
arial10.pyVariable pitch Arial. 10 pixels high.arial35.pyArial 35 high.arial_50.pyArial 50 high.courier20.pyFixed pitch Courier, 20 high.font6.pyFreeSans 14 high.font10.pyFreeSans 17 high.freesans20.pyFreeSans 20 high.
2.1.4 Hardware setup examples
The setup_examples directory contains example setup files for various hardware.
These are templates which may be adapted to suit the hardware in use, then
copied to the hardware root as color_setup.py. Example files:
ssd1306_pyb.pySetup file for monochrome displays using the official driver. Supports hard or soft SPI or I2C connections.ssd1106_spi_pico.pySetup file for monochrome displays. Supports hard or soft SPI or I2C connections.ssd1351_esp32.pyAs written supports an ESP32 connected to a 128x128 SSD1351 display. After editing to match the display and wiring, it should be copied to the target as/pyboard/color_setup.py.ssd1351_esp8266.pySimilar for ESP8266. Usage is somewhat experimental.st7735r_pyb.pyAssumes a Pyboard with an Adafruit 1.8 inch TFT display.st7735r144_pyb.pyFor a Pyboard with an Adafruit 1.44 inch TFT display.ili9341_esp32.pyA 240*320 ILI9341 display on ESP32.st7789_pico.pyExample with SSD7789 driver and Pi Pico host.st7789_ttgo.pySetup for the TTGO T-Display device.waveshare_pyb.py176*274 ePaper display on Pyboard.epd29_pyb_sync.pyAdafruit 2.9 inch ePaper display for synchronous code.epd29_pyb_async.pyAdafruit 2.9 inch ePaper display:asyncioapplications.
2.2 Dependencies
The source tree now includes all dependencies. These are listed to enable users to check for newer versions:
- writer.py Provides text rendering of Python font files.
A copy of the official driver for OLED displays using the SSD1306 chip is provided. The official file is here:
A copy of the unofficial driver for OLED displays using the SH1106 chip is provided. The unofficial file is here:
Displays based on the Nokia 5110 (PCD8544 chip) require this driver. It is not in this repo but may be found here:
Contents
2.3 Verifying hardware configuration
This script performs a basic check that the color_setup.py file matches the
hardware, that (on color units) all three primary colors can be displayed and
that pixels up to the edges of the display can be accessed. It is highly
recommended that this be run on any new installation.
from color_setup import ssd  # Create a display instance
from gui.core.colors import RED, BLUE, GREEN
from gui.core.nanogui import refresh
refresh(ssd, True)  # Initialise and clear display.
# Uncomment for ePaper displays
# ssd.wait_until_ready()
ssd.fill(0)
ssd.line(0, 0, ssd.width - 1, ssd.height - 1, GREEN)  # Green diagonal corner-to-corner
ssd.rect(0, 0, 15, 15, RED)  # Red square at top left
ssd.rect(ssd.width -15, ssd.height -15, 15, 15, BLUE)  # Blue square at bottom right
refresh(ssd)
For round displays please see Appendix 2 Round displays for a suitable hardware check script.
Contents
3. The nanogui module
The GUI supports a variety of widgets, some of which include text elements. The
coordinates of a widget are those of its top left corner. If a border is
specified, this is drawn outside of the limits of the widgets with a margin of
2 pixels. If the widget is placed at [row, col] the top left hand corner of
the border is at [row-2, col-2].
When a widget is drawn or updated (typically with its value method) it is not
immediately displayed. To update the display nanogui.refresh is called: this
enables multiple updates to the FrameBuffer contents before once copying the
buffer to the display. Postponement enhances performance providing a visually
instant update.
Text components of widgets are rendered using the Writer (monochrome) or
CWriter (colour) classes.
3.1 Application Initialisation
The GUI is initialised by issuing:
from color_setup import ssd
This defines the hardware as described in the drivers document.
A typical application then imports nanogui modules and clears the display:
from gui.core.nanogui import refresh
from gui.widgets.label import Label  # Import any widgets you plan to use
from gui.widgets.dial import Dial, Pointer
refresh(ssd, True)  # Initialise and clear display.
Initialisation of color text display follows. For each font a CWriter instance
is created:
from gui.core.writer import CWriter  # Renders color text
from gui.fonts import arial10  # A Python Font
from gui.core.colors import *  # Standard color constants

CWriter.set_textpos(ssd, 0, 0)  # In case previous tests have altered it
 # Instantiate any CWriters to be used (one for each font)
wri = CWriter(ssd, arial10, GREEN, BLACK, verbose=False)  # Colors are defaults
# wri = Writer(ssd, arial10, verbose=False)  # Monochrome display uses Writer
wri.set_clip(True, True, False)
Initialisation of monochrome text display follows. For each font a Writer instance
is created:
from gui.core.writer import Writer  # Renders color text
from gui.fonts import arial10

Writer.set_textpos(ssd, 0, 0)  # In case previous tests have altered it
# Instantiate any Writers to be used (one for each font)
wri = Writer(ssd, arial10, verbose=False)  # Monochrome display uses Writer
wri.set_clip(True, True, False)
Calling nanogui.refresh on startup sets up and clears the display. The method
will subsequently be called whenever a refresh is required. It takes two args:
deviceThe display instance (the GUI supports multiple displays).clear=FalseIf setTruethe display will be blanked; it is also blanked when a device is refreshed for the first time.
3.1.1 User defined colors
The file gui/core/colors.py defines standard color constants which may be
used with any display driver. This section describes how to change these or
to create additional colors.
Most of the color display drivers define colors as 8-bit or larger values. In such cases colors may be created and assigned to variables as follows:
from color_setup import SSD
PALE_YELLOW = SSD.rgb(150, 150, 0)
The GUI also provides drivers with 4-bit color to minimise RAM use. Colors are assigned to a lookup table having 16 entries. The frame buffer stores 4-bit color values, which are converted to the correct color depth for the hardware when the display is refreshed.
Of the possible 16 colors 13 are assigned in gui/core/colors.py, leaving
color numbers 12, 13 and 14 free. Any color can be assigned as follows:
from gui.core.colors import *  # Imports the create_color function
PALE_YELLOW = create_color(12, 150, 150, 0)
This creates a color rgb(150, 150, 0) assigns it to "spare" color number 12
then sets PALE_YELLOW to 12. Any color number in range 0 <= n <= 15 may be
used (implying that predefined colors may be reassigned). It is recommended
that BLACK (0) and WHITE (15) are not changed. If code is to be ported
between 4-bit and other drivers, use create_color() for all custom colors:
it will produce appropriate behaviour. See the vari_fields function in the
demo color15.py for an example.
3.1.2 Monochrome displays
Most widgets work on monochrome displays if color settings are left at default values. If a color is specified, drivers in this repo will convert it to black or white depending on its level of saturation. A low level will produce the background color, a high level the foreground. Consequently demos written for color displays will work on monochrome units.
On a monochrome OLED display the background is black and the foreground is white. This contrasts with ePaper units where the foreground is black on a white background. The display drivers perform this inversion so that user code renders as expected on color, mono OLED or ePaper units.
At the bit level 1 represents the foreground. This is white on an emitting
display such as an OLED. On a Sharp display it indicates reflection. On an
ePaper display it represents black. Given that 1 is the foreground color,
explicitly specifying BLACK on an ePaper will produce 0 as black has (very)
low saturation. In this context the resultant physically white background
color may come as a surprise.
In general the solution is to leave color settings at default.
3.1.3 Display update mechanism
A typical application comprises various widgets displaying user data. When a
widget's value method is called, the framebuffer's contents are updated to
reflect the widget's current state. The framebuffer is transferred to the
physical hardware when refresh(device) is called. This allows multiple
widgets to be refreshed at the same time. It also minimises processor overhead:
.value is generally fast, while refresh is slow because of the time taken
to transfer an entire buffer over SPI.
3.1.4 ePaper displays
On ePaper displays refresh is both slow and visually intrusive, with the
display flashing repeatedly. This made them unsatisfactory for displaying
rapidly changing information. There is a new breed of ePaper display supporting
effective partial updates notably
the Waveshare Pico paper 4.2.
This can be used in such roles and is discussed in
EPD Asynchronous support.
Contents
3.2 Label class
The purpose of a Label instance is to display text at a specific screen
location.
Text can be static or dynamic. In the case of dynamic text the background is cleared to ensure that short strings cleanly replace longer ones.
Labels can be displayed with an optional single pixel border.
Colors are handled flexibly. By default the colors used are those of the
Writer instance, however they can be changed dynamically; this might be used
to warn of overrange or underrange values. The color15.py demo illustrates
this.
Constructor args:
writerTheWriterinstance (font and screen) to use.rowLocation on screen.coltextIf a string is passed it is displayed: typically used for static text. If an integer is passed it is interpreted as the maximum text length in pixels; typically obtained fromwriter.stringlen('-99.99'). Nothing is displayed until.value()is called. Intended for dynamic text fields.invert=FalseDisplay in inverted or normal style.fgcolor=NoneOptionally overrides theWritercolors.bgcolor=Nonebdcolor=FalseIfFalseno border is displayed. IfNonea border is shown in theWriterforeground color. If a color is passed, it is used.align=ALIGN_LEFTBy default text in labels is left aligned. Options areALIGN_RIGHTandALIGN_CENTER. These options can only take effect if a large enough field width is passed totext.
The constructor displays the string at the required location.
Methods:
valueRedraws the label. This takes the following args:text=NoneThe text to display. IfNonedisplays the last value.invert=FalseIf true, show inverse text.fgcolor=NoneForeground color: ifNonetheWriterdefault is used.bgcolor=NoneBackground color, as per foreground.bdcolor=NoneBorder color. As per above except that ifFalseis passed, no border is displayed. This clears a previously drawn border.align=NoneUse alignment specified in constructor unless one of the module constants is passed.
Returns the current text string.
showNo args. (Re)draws the label. Primarily for internal use by GUI.
Module Constants:
ALIGN_LEFT=0ALIGN_RIGHT=1ALIGN_CENTER=2
If populating a label would cause it to extend beyond the screen boundary a warning is printed at the console. The label may appear at an unexpected place. The following is a complete "Hello world" script.
from color_setup import ssd  # Create a display instance
from gui.core.nanogui import refresh
from gui.core.writer import CWriter
from gui.core.colors import *

from gui.widgets.label import Label
import gui.fonts.freesans20 as freesans20

refresh(ssd)  # Initialise and clear display.
CWriter.set_textpos(ssd, 0, 0)  # In case previous tests have altered it
wri = CWriter(ssd, freesans20, GREEN, BLACK, verbose=False)
wri.set_clip(True, True, False)

# End of boilerplate code. This is our application:
Label(wri, 2, 2, 'Hello world!')
refresh(ssd)
Contents
3.3 Meter class
This provides a vertical linear meter display of values scaled between 0.0 and 1.0.
Constructor positional args:
writerTheWriterinstance (font and screen) to use.rowLocation on screen.col
Keyword only args:
height=50Height of meter.width=10Width.fgcolor=NoneForeground color: ifNonetheWriterdefault is used.bgcolor=NoneBackground color, as per foreground.ptcolor=NoneColor of meter pointer or bar. Default is foreground color.bdcolor=FalseIfFalseno border is displayed. IfNonea border is shown in theWriterforeground color. If a color is passed, it is used.divisions=5No. of graduations to show.label=NoneA text string will cause aLabelto be drawn below the meter. An integer will create aLabelof that width for later use.style=Meter.LINEThe pointer is a horizontal line.Meter.BARcauses a vertical bar to be displayed. Much easier to read on monochrome displays.legends=NoneIf a tuple of strings is passed,Labelinstances will be displayed to the right hand side of the meter, starting at the bottom. E.G.('0.0', '0.5', '1.0')value=NoneInitial value. IfNonethe meter will not be drawn until itsvalue()method is called.
Methods:
valueArgs:n=None, color=None.nshould be a float in range 0 to 1.0. Causes the meter to be updated. Out of range values are constrained. IfNoneis passed the meter is not updated.colorUpdates the color of the bar or line if a value is also passed.Nonecauses no change. Returns the current value.
textUpdates the label if present (otherwise throws aValueError). Args:text=NoneThe text to display. IfNonedisplays the last value.invert=FalseIf true, show inverse text.fgcolor=NoneForeground color: ifNonetheWriterdefault is used.bgcolor=NoneBackground color, as per foreground.bdcolor=NoneBorder color. As per above except that ifFalseis passed, no border is displayed. This clears a previously drawn border.
showNo args. (Re)draws the meter. Primarily for internal use by GUI.
Contents
3.4 LED class
This is a virtual LED whose color may be altered dynamically.
Constructor positional args:
writerTheWriterinstance (font and screen) to use.rowLocation on screen.col
Keyword only args:
height=12Height of LED.fgcolor=NoneForeground color: ifNonetheWriterdefault is used.bgcolor=NoneBackground color, as per foreground.bdcolor=FalseIfFalseno border is displayed. IfNonea border is shown in theWriterforeground color. If a color is passed, it is used.label=NoneA text string will cause aLabelto be drawn below the LED. An integer will create aLabelof that width for later use.
Methods:
colorargc=NoneChange the LED color toc. IfcisNonethe LED is turned off (rendered in the background color).textUpdates the label if present (otherwise throws aValueError). Args:text=NoneThe text to display. IfNonedisplays the last value.invert=FalseIf true, show inverse text.fgcolor=NoneForeground color: ifNonetheWriterdefault is used.bgcolor=NoneBackground color, as per foreground.bdcolor=NoneBorder color. As per above except that ifFalseis passed, no border is displayed. This clears a previously drawn border.
showNo args. (Re)draws the LED. Primarily for internal use by GUI.
Contents
3.5 Dial and Pointer classes
A Dial is a circular display capable of displaying a number of vectors; each
vector is represented by a Pointer instance. The format of the display may be
chosen to resemble an analog clock or a compass. In the CLOCK case a pointer
resembles a clock's hand extending from the centre towards the periphery. In
the COMPASS case pointers are chevrons extending equally either side of the
circle centre.
In both cases the length, angle and color of each Pointer may be changed
dynamically. A Dial can include an optional Label at the bottom which may
be used to display any required text.
In use, a Dial is instantiated then one or more Pointer objects are
instantiated and assigned to it. The Pointer.value method enables the Dial
to be updated affecting the length, angle and color of the Pointer.
Pointer values are complex numbers.
Dial class
Constructor positional args:
writerTheWriterinstance (font and screen) to use.rowLocation on screen.col
Keyword only args:
height=50Height and width of dial.fgcolor=NoneForeground color: ifNonetheWriterdefault is used.bgcolor=NoneBackground color, as per foreground.bdcolor=FalseIfFalseno border is displayed. IfNonea border is shown in theWriterforeground color. If a color is passed, it is used.ticks=4No. of gradutions to show.label=NoneA text string will cause aLabelto be drawn below the meter. An integer will create aLabelof that width for later use.style=Dial.CLOCKPointers are drawn from the centre of the circle as per the hands of a clock.Dial.COMPASScauses pointers to be drawn as arrows centred on the control's centre. Arrow tail chevrons are suppressed for very short pointers.pip=NoneDraws a central dot. A color may be passed, otherwise the foreground color will be used. IfFalseis passed, no pip will be drawn. The pip is suppressed if the shortest pointer would be hard to see.
When a Pointer is instantiated it is assigned to the Dial by the Pointer
constructor.
Bound variable:
labelTheLabelinstance if one was created.
Pointer class
Constructor arg:
dialTheDialinstance on which it is to be displayed.
Methods:
valueArgs:v=NoneThe value is a complex number. A magnitude exceeding unity is reduced (preserving phase) to constrain thePointerwithin the unit circle.color=NoneBy default the pointer is rendered in the foreground color of the parentDial. Otherwise the passed color is used. Returns the current value.
showNo args. (Re)draws the control. Primarily for internal use by GUI.
Typical usage (ssd is the device and wri is the current Writer):
def clock(ssd, wri):
    # Border in Writer foreground color:
    dial = Dial(wri, 5, 5, ticks = 12, bdcolor=None)
    hrs = Pointer(dial)
    mins = Pointer(dial)
    hrs.value(0 + 0.7j, RED)
    mins.value(0 + 0.9j, YELLOW)
    dm = cmath.exp(-1j * cmath.pi / 30)  # Rotate by 1 minute
    dh = cmath.exp(-1j * cmath.pi / 1800)  # Rotate hours by 1 minute
    # Twiddle the hands: see aclock.py for an actual clock
    for _ in range(80):
        utime.sleep_ms(200)
        mins.value(mins.value() * dm, RED)
        hrs.value(hrs.value() * dh, YELLOW)
        refresh(ssd)
Contents
3.6 Scale class
This displays floating point data having a wide dynamic range. It is modelled on old radios where a large scale scrolls past a small window having a fixed pointer. This enables a scale with (say) 200 graduations (ticks) to readily be visible on a small display, with sufficient resolution to enable the user to interpolate between ticks. Default settings enable estimation of a value to within about +-0.1%.
Legends for the scale are created dynamically as it scrolls past the window.
The user may control this by means of a callback. The example lscale.py
illustrates a variable with range 88.0 to 108.0, the callback ensuring that the
display legends match the user variable. A further callback enables the scale's
color to change over its length or in response to other circumstances.
The scale displays floats in range -1.0 <= V <= 1.0.
Constructor positional args:
writerTheWriterinstance (font and screen) to use.rowLocation on screen.col
Keyword only arguments (all optional):
ticks=200Number of "tick" divisions on scale. Must be divisible by 2.legendcb=NoneCallback for populating scale legends (see below).tickcb=NoneCallback for setting tick colors (see below).height=0Pass 0 for a minimum height based on the font height.width=200bdcolor=NoneBorder color. IfNone,fgcolorwill be used.fgcolor=NoneForeground color. Defaults to system color.bgcolor=NoneBackground color defaults to system background.pointercolor=NoneColor of pointer. Defaults to.fgcolor.fontcolor=NoneColor of legends. Defaultfgcolor.
Method:
value=NoneSet or get the current value. Always returns the current value. A passedfloatis constrained to the range -1.0 <= V <= 1.0 and becomes theScale's current value. TheScaleis updated. PassingNoneenables reading the current value, but see note below on precision.
Callback legendcb
The display window contains 20 ticks comprising two divisions; by default a
division covers a range of 0.1. A division has a legend at the start and end
whose text is defined by the legendcb callback. If no user callback is
supplied, legends will be of the form 0.3, 0.4 etc. User code may override
these to cope with cases where a user variable is mapped onto the control's
range. The callback takes a single float arg which is the value of the tick
(in range -1.0 <= v <= 1.0). It must return a text string. An example from the
lscale.py demo shows FM radio frequencies:
def legendcb(f):
    return '{:2.0f}'.format(88 + ((f + 1) / 2) * (108 - 88))
The above arithmetic aims to show the logic. It can (obviously) be simplified.
Callback tickcb
This callback enables the tick color to be changed dynamically. For example a
scale might change from green to orange, then to red as it nears the extremes.
The callback takes two args, being the value of the tick (in range
-1.0 <= v <= 1.0) and the default color. It must return a color. This example
is taken from the scale.py demo:
def tickcb(f, c):
    if f > 0.8:
        return RED
    if f < -0.8:
        return BLUE
    return c
Increasing the ticks value
This increases the precision of the display.
It does this by lengthening the scale while keeping the window the same size,
with 20 ticks displayed. If the scale becomes 10x longer, the value diference
between consecutive large ticks and legends is divided by 10. This means that
the tickcb callback must return a string having an additional significant
digit. If this is not done, consecutive legends will have the same value.
Precision
For performance reasons the control stores values as integers. This means that
if you set value and subsequently retrieve it, there may be some loss of
precision. Each visible division on the control represents 10 integer units.
Contents
3.7 Class Textbox
Displays multiple lines of text in a field of fixed dimensions. Text may be clipped to the width of the control or may be word-wrapped. If the number of lines of text exceeds the height available, scrolling will occur. Access to text that has scrolled out of view may be achieved by calling a method. The widget supports fixed and variable pitch fonts.
from gui.widgets.textbox import Textbox
Constructor mandatory positional arguments:
writerTheWriterinstance (font and screen) to use.rowLocation on screen.colwidthWidth of the object in pixels.nlinesNumber of lines of text to display. The object's height is determined from the height of the font:
height in pixels = nlines*font_height
As per most widgets the border is drawn two pixels beyond the control's boundary.
Keyword only arguments:
bdcolor=NoneBorder color. IfNone,fgcolorwill be used.fgcolor=NoneColor of border. Defaults to system color.bgcolor=NoneBackground color of object. Defaults to system background.clip=TrueBy default lines too long to display are right clipped. IfFalseis passed, word-wrap is attempted. If the line contains no spaces it will be wrapped at the right edge of the window.
Methods:
appendArgss, ntrim=None, line=NoneAppend the stringsto the display and scroll up as required to show it. By default only the number of lines which will fit on screen are retained. If an integerntrim=Nis passed, only the last N lines are retained;ntrimmay be greater than can be shown in the control, hidden lines being accessed by scrolling.
If an integer (typically 0) is passed inlinethe display will scroll to show that line.scrollArgnNumber of lines to scroll. A negative number scrolls up. If scrolling would achieve nothing because there are no extra lines to display, nothing will happen. ReturnsTrueif scrolling occurred, otherwiseFalse.valueNo args. Returns the number of lines of text stored in the widget.clearNo args. Clears all lines from the widget and refreshes the display.gotoArgline=NoneFast scroll to a line. By default shows the end of the text. 0 shows the start.
Fast updates:
Rendering text to the screen is relatively slow. To send a large amount of text
the fastest way is to perform a single append. Text may contain newline
('\n') characters as required. In that way rendering occurs once only.
ntrim__
If text is regularly appended to a Textbox its buffer grows, using RAM. The
value of ntrim sets a limit to the number of lines which are retained, with
the oldest (topmost) being discarded as required.
Contents
4. ESP8266
Some personal observations on successful use with an ESP8266.
I chose an Adafruit 128x128 OLED display to represent the biggest display I thought the ESP8266 might support. I reasoned that, if this can be made to work, smaller or monochrome displays would present no problem.
The ESP8266 is a minimal platform with typically 36.6KiB of free RAM. The framebuffer for a 128*128 OLED requires 16KiB of contiguous RAM (the display hardware uses 16 bit color but my driver uses an 8 bit buffer to conserve RAM). The 4-bit driver halves this size.
A further issue is that, by default, ESP8266 firmware does not support complex
numbers. This rules out the plot module and the Dial widget. It is possible
to turn on complex support in the build, but I haven't tried this.
I set out to run the scale.py and textbox.py demos as these use asyncio
to create dynamic content, and the widgets themselves are relatively complex.
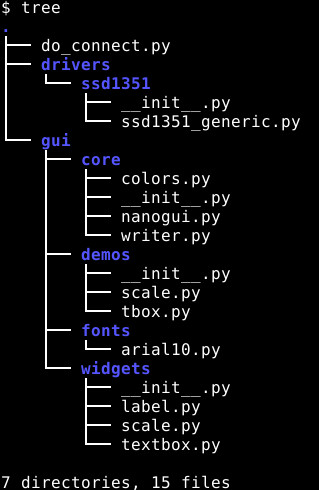
I froze a subset of the drivers and the gui directories. A subset minimises
the size of the firmware build and eliminates modules which won't compile due
to the complex number issue. The directory structure in my frozen modules
directory matched that of the source. This was the structure of my frozen
directory before I added the 4 bit driver:
I erased the flash, built and installed the new firmware. Finally I copied
setup_examples/esp8266_setup.py to /pyboard/color_setup.py. This could have
been frozen but I wanted to be able to change pins if required.
Both demos worked perfectly.
I modified the demos to regularly report free RAM. scale.py reported 10480
bytes, tbox.py reported 10512 bytes, sometimes more, as the demo progressed.
With the 4 bit driver scale.py reported 18112 bytes. In conclusion I think
that applications of moderate complexity should be feasible.
Contents
Appendix 1 Freezing bytecode
This achieves a major saving of RAM. The correct way to do this is via a
manifest file.
The first step is to clone MicroPython and prove that you can build and deploy
firmware to the chosen platform. Build instructions vary between ports and can
be found in the MicroPython source tree in ports/<port>/README.md.
The following is an example of how the entire GUI with fonts, demos and all widgets can be frozen on RP2.
Build script:
cd /mnt/qnap2/data/Projects/MicroPython/micropython/ports/rp2
MANIFEST='/mnt/qnap2/Scripts/manifests/rp2_manifest.py'

make submodules
make clean
if make -j 8 BOARD=PICO FROZEN_MANIFEST=$MANIFEST
then
    echo Firmware is in build-PICO/firmware.uf2
else
    echo Build failure
fi
cd -
Manifest file contents (first line ensures that the default files are frozen):
include("$(MPY_DIR)/ports/rp2/boards/manifest.py")
freeze('/mnt/qnap2/Scripts/modules/rp2_modules')
The directory /mnt/qnap2/Scripts/modules/rp2_modules contains only a symlink
to the gui directory of the micropython-micro-gui source tree. The freezing
process follows symlinks and respects directory structures.
It is usually best to keep hardware_setup.py unfrozen for ease of making
changes. I also keep the display driver and boolpalette.py in the filesystem
as I have experienced problems freezing display drivers - but feel free to
experiment.
Contents
Appendix 2 Round displays
The normal test script is unsuitable as the rectangles are off-screen. Please paste this at the REPL to verify hardware and display orientation:
from color_setup import ssd  # Create a display instance
from gui.core.colors import RED, BLUE, GREEN
from gui.core.nanogui import refresh, circle
refresh(ssd, True)  # Initialise and clear display.
ssd.fill(0)
w = ssd.width
ssd.line(0, 0, w - 1, w - 1, GREEN)  # Green diagonal corner-to-corner
offs = round(0.29289 * w / 2)
ssd.rect(offs, offs, 15, 15, RED)  # Red square at top left
ssd.rect(w - offs - 15, w - offs - 15, 15, 15, BLUE)  # Blue square at bottom right
circle(ssd, 119, 119, 119, GREEN)
refresh(ssd)