kopia lustrzana https://github.com/RobertGawron/IonizationChamber
52 wiersze
1.8 KiB
Markdown
52 wiersze
1.8 KiB
Markdown
# Firmware
|
|
|
|
|
|
## Setup
|
|
|
|
* [Setting up development environment on Linux
|
|
](https://github.com/RobertGawron/IonizationChamber/wiki/Setting-up-development-environment-on-Linux)
|
|
|
|
|
|
## Architecture
|
|
|
|
<img src="../../Documentation/Diagrams/HostArchitecture.svg" width="100%">
|
|
|
|
## Collecting measurements
|
|
|
|
1. **Edit config.py** to select the correct COM port of Ionization Chamber. Note that **useDMM flag should be set to False**, is experimental and was supposed to be used to check the correlation of Ionization Chamber with other factors (measured by DMM with SCPI support), such factors could be e.g. temperature.
|
|
|
|
2. **Run data acquisition script**, it will log Ionization Chamber output on the screen and also it will save it to data.csv for further processing.
|
|
|
|
```python main.py```
|
|
|
|
3. When all data is logged, terminate ```python main.py``.
|
|
|
|
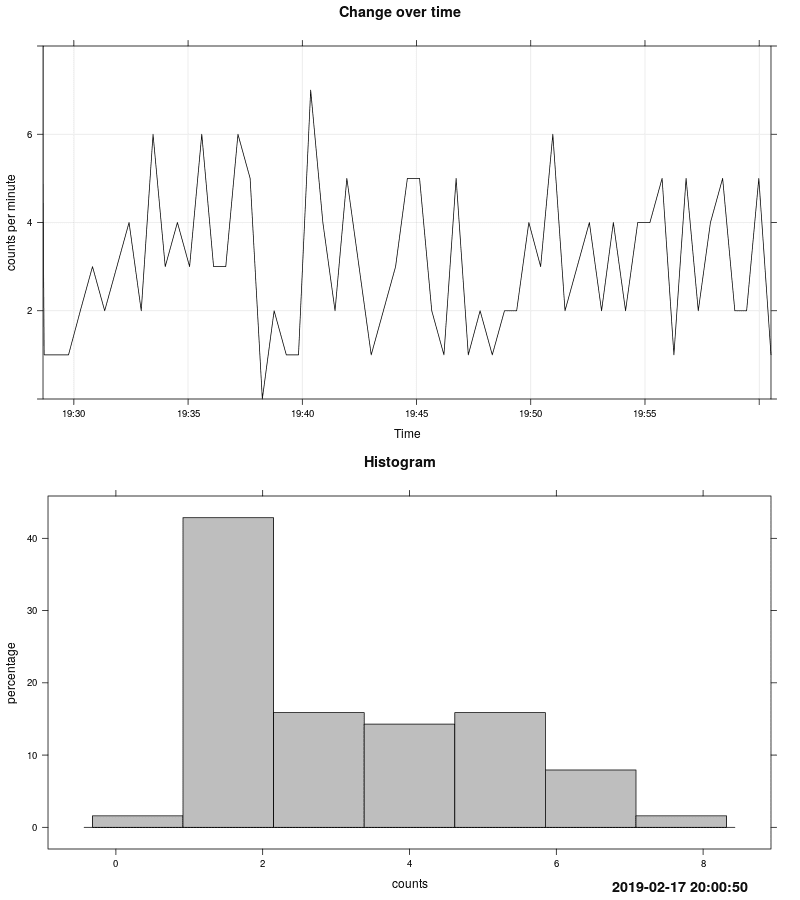
## Plotting signal value in domain time + plotting histogram
|
|
|
|
This mode is useful to look on measurement changes over time.
|
|
|
|
After collecting data run script to post-process it and generate diagrams:
|
|
|
|
```Rscript main.R```
|
|
|
|
A new .png image with timestamp in its name will be created in directory where script is.
|
|
|
|
Below is example of such generated plot.
|
|
|
|
|
|
|
|
|
|
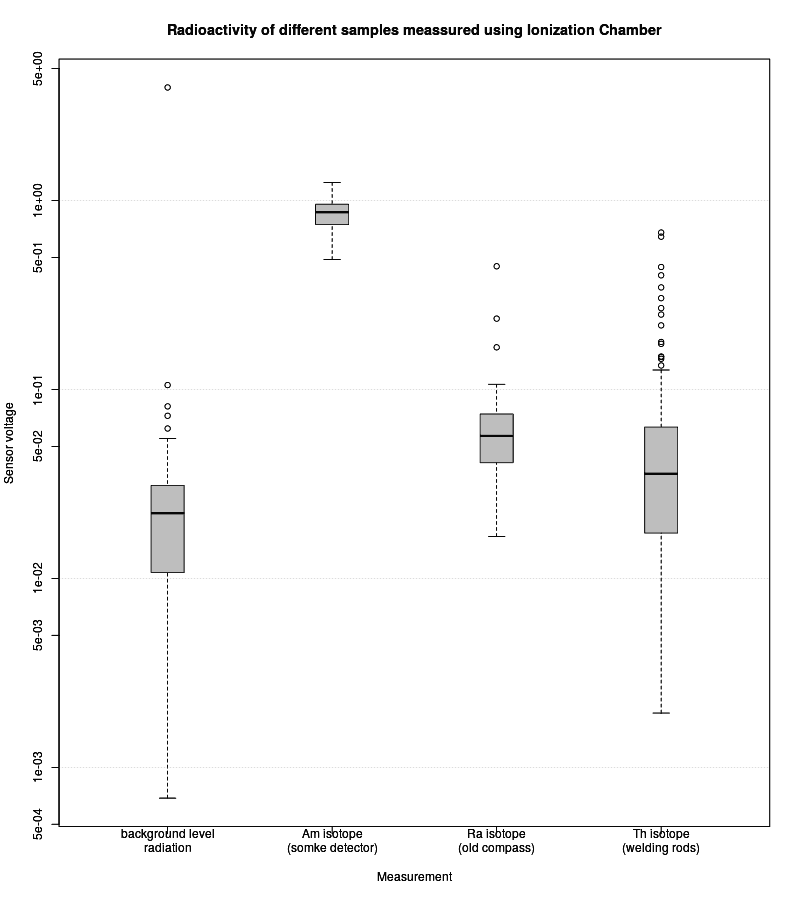
## Plotting values from different measurements [(box plot)](https://en.wikipedia.org/wiki/Box_plot)
|
|
|
|
1. Collect data from different samples as different .csv files.
|
|
2. Edit ```boxplot.R```, to match filenames of .cvs files and labels of measurements.
|
|
3. Run:
|
|
|
|
```Rscript boxplot.R```
|
|
|
|
A new .png image with timestamp in its name will be created in directory where script is.
|
|
|
|
Below is example of such generated plot.
|
|
|
|
|