1.8 KiB
Firmware
Setup
Architecture

Collecting measurements
-
Edit config.py to select the correct COM port of Ionization Chamber. Note that useDMM flag should be set to False, is experimental and was supposed to be used to check the correlation of Ionization Chamber with other factors (measured by DMM with SCPI support), such factors could be e.g. temperature.
-
Run data acquisition script, it will log Ionization Chamber output on the screen and also it will save it to data.csv for further processing.
python main.py
- When all data is logged, terminate ```python main.py``.
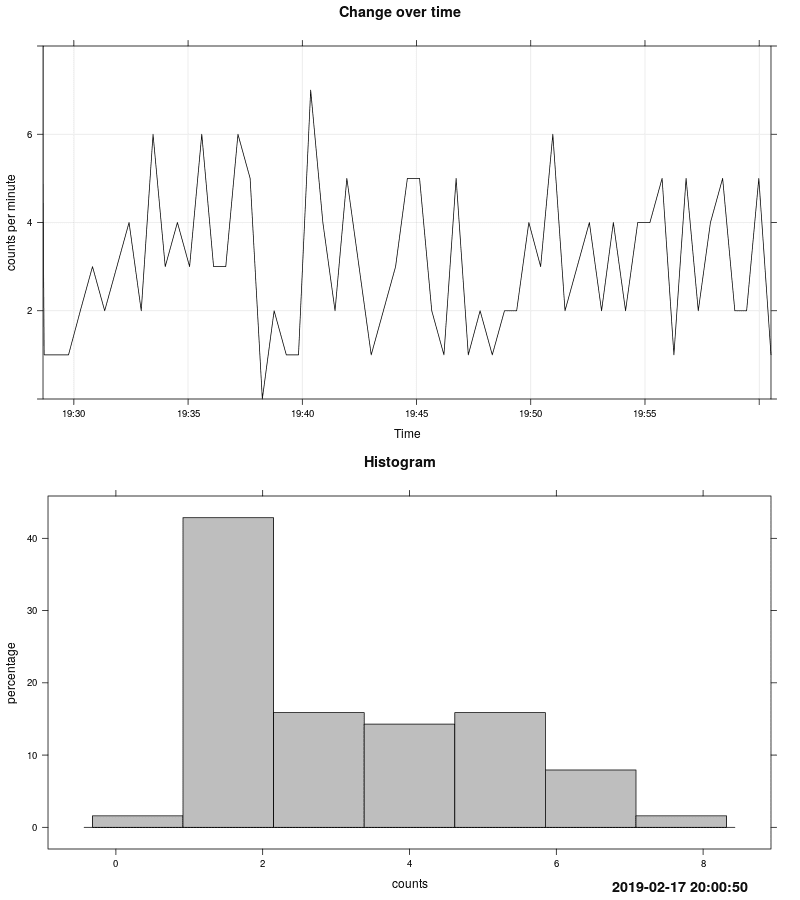
Plotting signal value in domain time + plotting histogram
This mode is useful to look on measurement changes over time.
After collecting data run script to post-process it and generate diagrams:
Rscript main.R
A new .png image with timestamp in its name will be created in directory where script is.
Below is example of such generated plot.
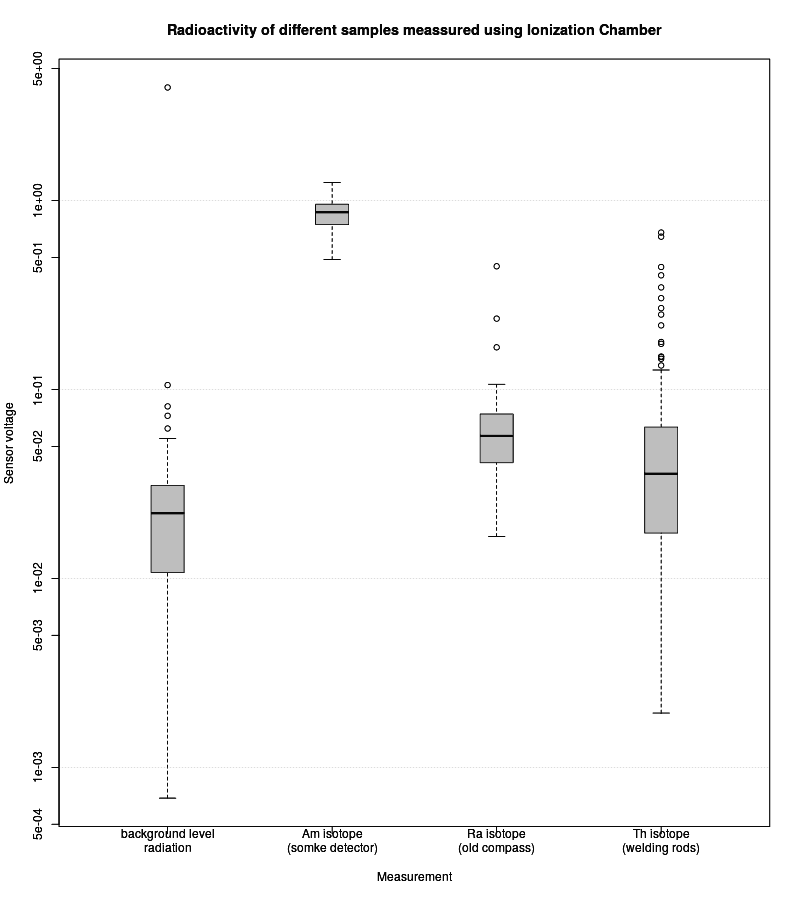
Plotting values from different measurements (box plot)
- Collect data from different samples as different .csv files.
- Edit
boxplot.R, to match filenames of .cvs files and labels of measurements. - Run:
Rscript boxplot.R
A new .png image with timestamp in its name will be created in directory where script is.
Below is example of such generated plot.