Bump werkzeug from 0.15.3 to 2.2.3 in /app |
||
|---|---|---|
| Grafana | ||
| app | ||
| esp8266 | ||
| screenshots | ||
| .gitignore | ||
| README.md | ||
README.md
ESP8266 driven weather station with a Flask webserver frontend and Influx/Grafana plotting.
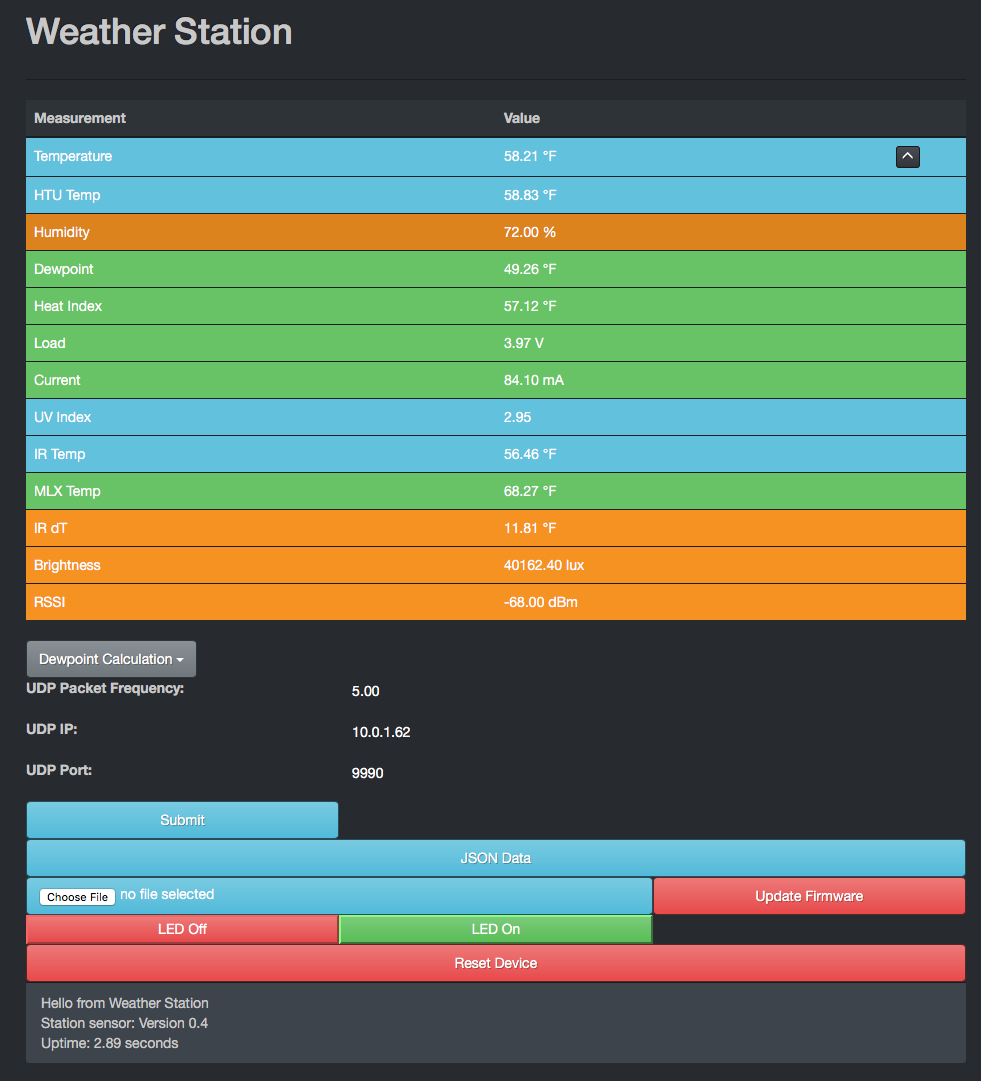
There are two main components to this project. The device source in esp8266/ and the webserver in app/. Data on device can be accessed directly via:
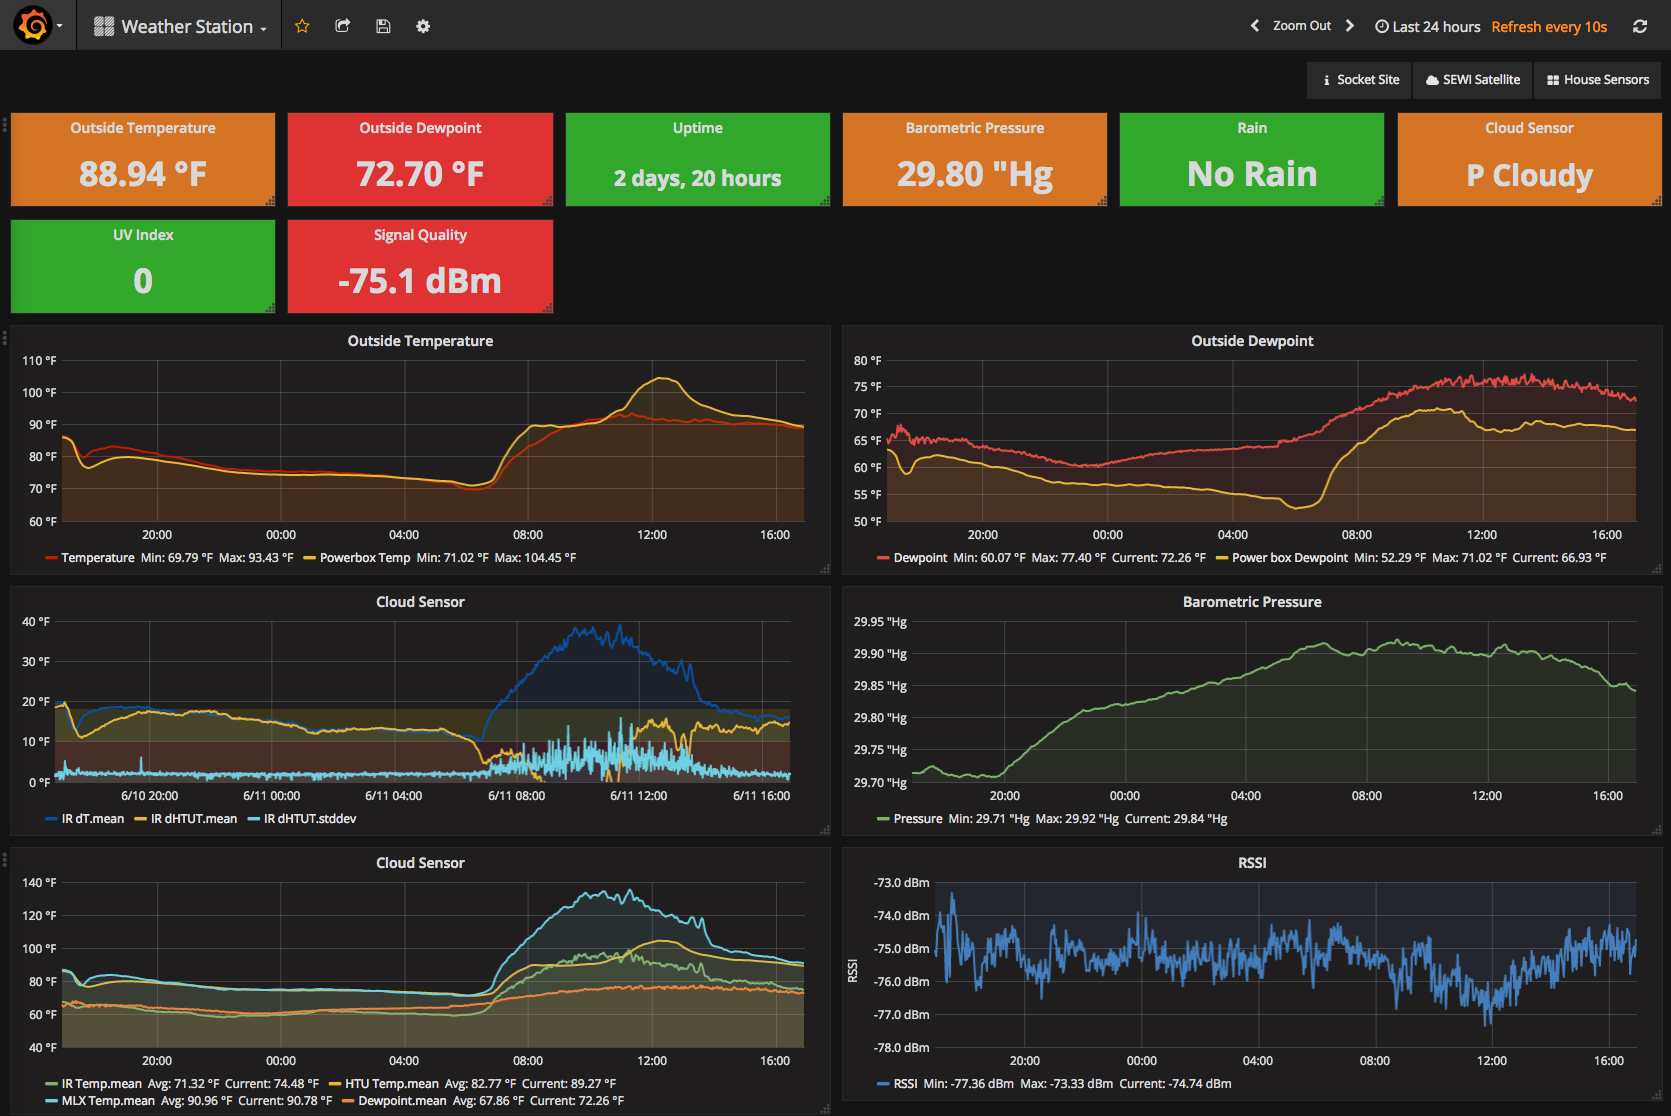
http://deviceIP. Additionally, a Grafana and Influx server can be configured to display historical data and is highly configurable.
Device configuration
For debugging purposes, the device can have firmware uploaded directly from the webpage. It's recommended that after deployment, this feature be removed for security.
I'd recommend platformio for compiling and distributing the esp8266 source to devices.

Flask frontend
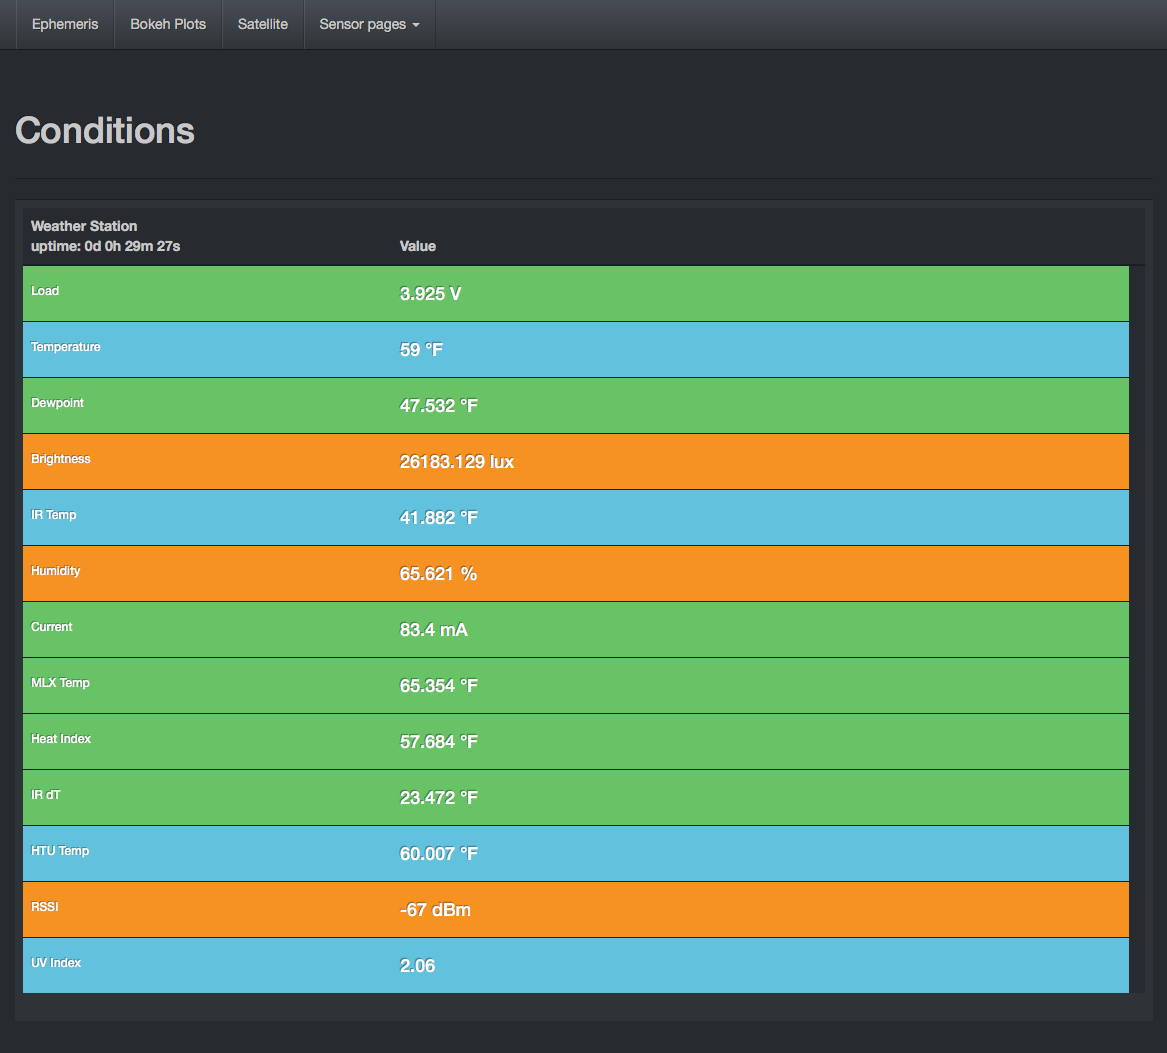
Flask and SocketIO frontend to weather station. It can accept multiple stations simultaneously.
To setup:
pip -r requirements
To run: Run station receiver that pushes socketIO packets to flask webserver which also posts the data to an Influx database server. You'll need to change the database server if it's not the localhost:
python stationServerInfluxDB.py
In this file, you'll need to specify the Influx server and create a database on it named StationDB.
Run flask webserver that listens for SocketIO packets:
python app.py
Webpage will be located at and will update when packet is received from stations http://localhost:5000/
Influx and Grafana configuration
I'd recommend installing Influx and Grafana via docker for minimal headache. Install docker here: https://www.docker.com/
###InfluxDB setup: Pull down the influxdb docker images:
docker pull influxdb
Then run the image as a container named influx. The port forwarding is done from the container to your local machine.
docker run -d --name influx -p 8086:8086 -p 8083:8083 -v /local/machine/path/to/db:/var/lib/influxdb -e INFLUXDB_ADMIN_ENABLED=true influxdb
Navigate to http://localhost:8083 and create a database with name StationDB
###Grafana setup: As with Influx, pull down the docker image for grafana:
docker pull grafana/grafana
docker run -d --name grafana -p 3000:3000 grafana/grafana
Navigate to http://localhost:3000 and start creating Grafana dashboards for plotting and monitoring your data.
An example json file of a sample dashboard is given in Grafana/sample.json

