|
|
||
|---|---|---|
| css | ||
| examples | ||
| src | ||
| test | ||
| .gitignore | ||
| .travis.yml | ||
| CONTRIBUTING.md | ||
| DATA-FORMATTING.md | ||
| Gruntfile.js | ||
| LICENSE.md | ||
| README.md | ||
| index.js | ||
| package.json | ||
README.md
ViziCities (0.1)
Bringing cities to life using the power of open data and the Web
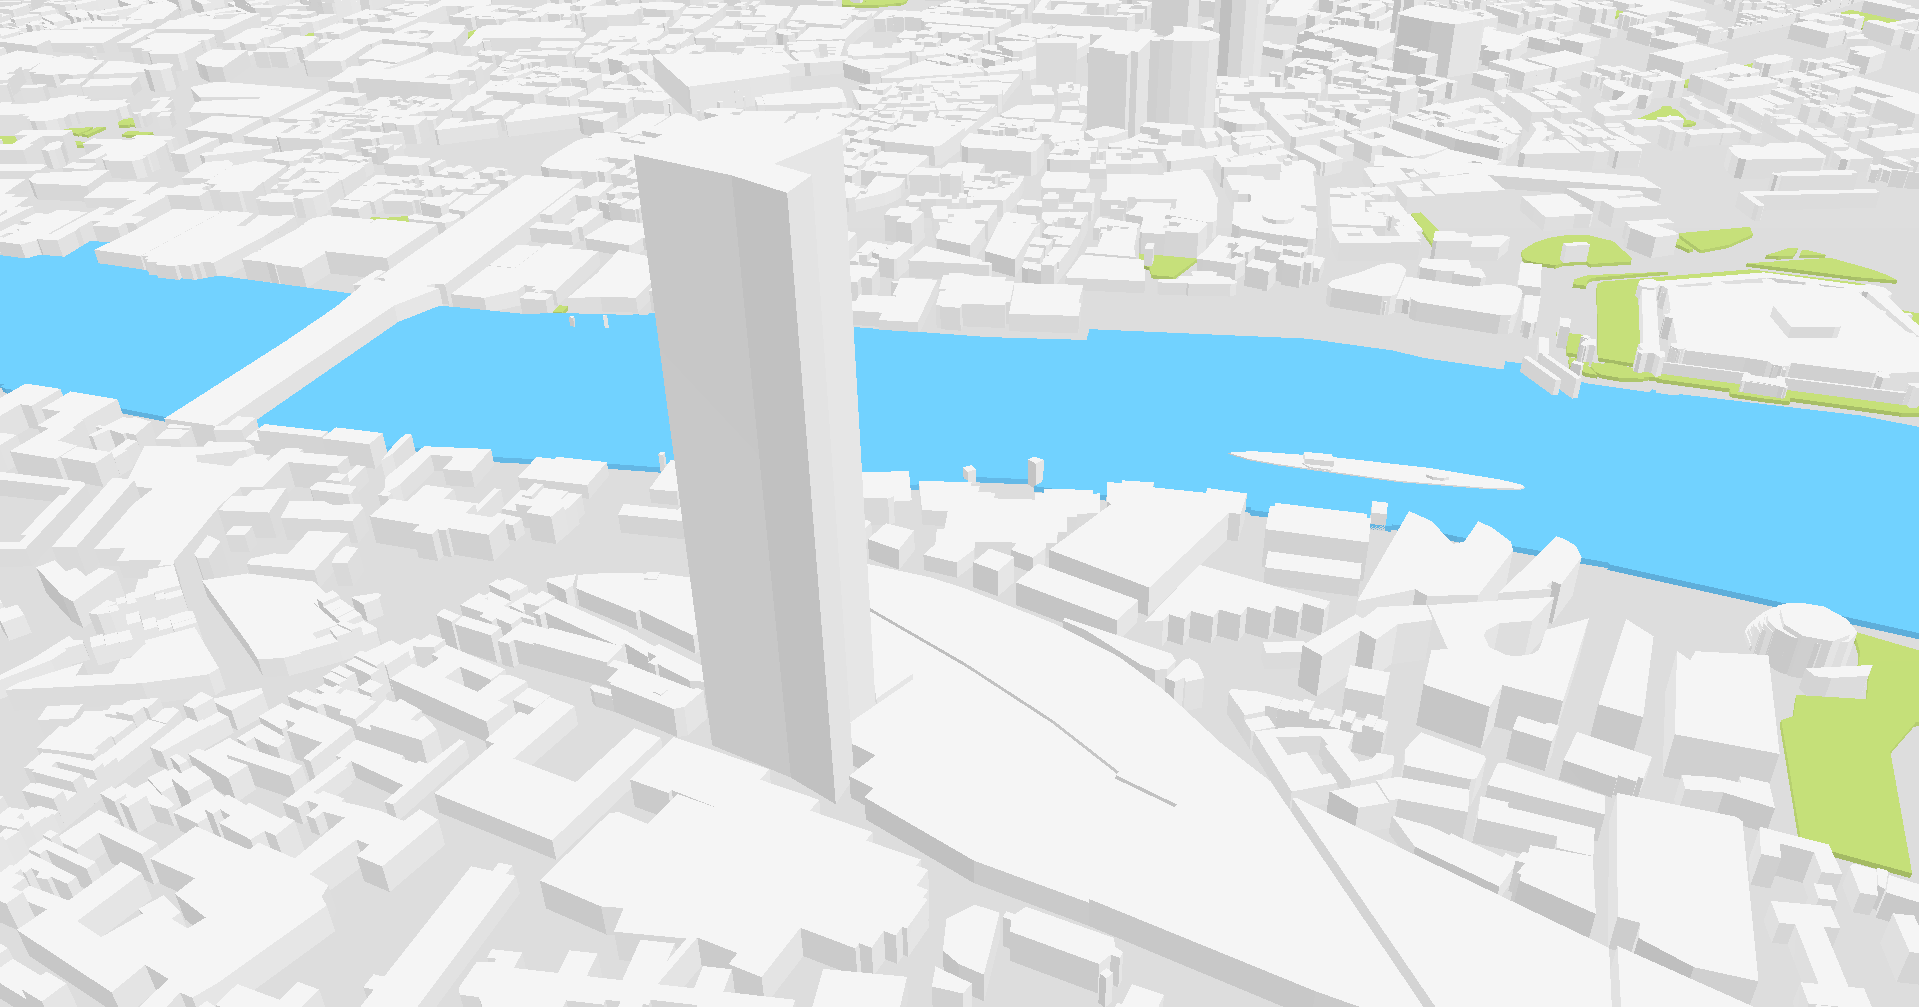
ViziCities is a 3D city and data visualisation platform, powered by WebGL. Its purpose is to change the way you look at cities and the data contained within them.
Demonstration
Here's a demo of ViziCities so you can have a play without having to build it for yourself. Cool, ey?
What does it do?
ViziCities aims to combine data visualisation with a 3D representation of a city to provide a better understanding what's going on. It's a powerful new way of looking at and understanding urban areas.
Aside from seeing a city in 3D, here are some of the others things you'll have the power to do:
- View public transport (eg. buses, trains, planes) flowing around a city in realtime
- Use vehicles powered by artificial intelligence to perform realistic traffic simulation
- Visualise social data in realtime
- Overlay historic and static data (eg. census data) using traditional techniques (eg. heatmaps)
- And much more…
Further information
For more information you should start here:
Features
ViziCities is currently in a pre-alpha state, meaning things are changing rapidly and you should expect bugs.
0.1.0-pre
- Load anywhere in the world using coordinates in the URL (#lat,lon) (like Oslo)
- Buildings, water (rivers, canals, etc), and green areas (parks, grass, forest, etc)
- Dynamic data loading using the OpenStreetMap Overpass API (literally the entire world)
- Accurate heights based on OpenStreetMap tags, if available
- Loading of data using a TMS grid system
- Caching of loaded grid data to prevent duplicated requests
- Processing of geographic features into 3D objects using Web Workers
- Controls (zoom, pan and orbit)
- Basic tests and build status using Travis CI
- Grunt-based development environment
Future features
- 3D road network
- Static data visualisation layers (heatmaps, bar charts, etc)
- Live data visualisation (tweets, public transport, etc)
- AI vehicles and pedestrians
- Local weather
- Post processing (DoF, SSAO, etc)
- 3D terrain
- And much more…
Known issues
ViziCities is not complete and there are likely many things that could be done better or simply need fixing. Here is a list of the major known issues:
- Not all features from OpenStreetMap are being displayed (particularly relations)
- Performance of tile-based loading mechanism is poor
- Web Worker processing isn't efficient due to the way scripts and data are loaded
- Caching is reset on page reload
- XHR requests for data can take some time, causing visible delay
- Performance issues with dense cities (eg. NYC)
Getting started
ViziCities is at an incredibly early stage right now, but it's usable if you know what you're doing. The following steps should get you up and running without too much trouble.
Building ViziCities
To start off, you'll need to build ViziCities and get an up-to-date JavaScript file.
Clone the ViziCities repo
git clone https://github.com/vizicities/vizicities.git vizicities
Install Node.js & NPM
If you haven't already, install Homebrew before going any further.
brew install node
Install the Grunt CLI
npm install -g grunt-cli
Install the NPM packages
cd /path/to/vizicities
npm install
Build ViziCities and watch for file changes using Grunt
cd /path/to/vizicities
grunt dev
Serve examples using Grunt
Open a new terminal tab or window, then type:
cd /path/to/vizicities
grunt serve
Then open http://localhost:8000/examples
Using ViziCities
Use the built in example to get an idea of what ViziCities can do. Change the coordinates to load a new part of the world (anywhere you want).
Getting involved
ViziCities can't happen without your help. We need people to submit bugs, suggest features, share how they're using the project, and contribute code. Sound like you? Check out exactly how to get involved.
Suggestions
There are a couple of things in particular that need your help:
- Styling improvements (play with the lighting and materials, add shaders, make things look pretty)
- Performance improvements (particularly with feature processing, generation and rendering)
Contact & community
Communicate with the ViziCities team via email (hello@vizicities.com) and Twitter (@ViziCities). All other discussion should happen in the ViziCities Google Group, IRC (#vizicities on Freenode) or relevant GitHub issues page.
Libraries and resources used
- OpenStreetMap – Map data
- Three.js – WebGL
- D3.js – Geographic coordinate conversion
- Underscore.js – General helpers
- Q – Promises
- Throat - Limiting concurrency
- Catiline – Web Workers
- Dat.gui – Debug control panel
- FPSMeter – FPS meter
- Moment.js – Date processing
- Simplify.js – Polygon simplification
- Grunt – Build system
FAQ
What happened to all the cool features I saw in the blog posts?
Over the past year we've been producing experiments to prove that ViziCities is possible. These experiments, while working, were not robust and never intended for release. The version of ViziCities you see here is a solid foundation based on the lessons learnt from the previous experiments. It will eventually catch up with those experiments in regards to features.
What are the controls?
- Zoom using the mouse wheel
- Pan using the left mouse button
- Orbit by holding shift and using the left mouse button, or using the middle mouse button