kopia lustrzana https://github.com/marceloprates/prettymaps
* Use `prune **` to remove all files from the sdist
    - c.f. https://packaging.python.org/guides/using-manifest-in/#manifest-in-commands
    - "Setuptools also has undocumented support for ** matching zero or
       more characters including forward slash, backslash, and colon."
* Manually include all "default" files for a sdist in MANIFEST.in
    - c.f. https://packaging.python.org/guides/using-manifest-in/#how-files-are-included-in-an-sdist
* Include requirements.txt as not using declartive spec for setup
|
||
|---|---|---|
| .devcontainer | ||
| .github | ||
| assets/Permanent_Marker | ||
| docs | ||
| notebooks | ||
| prettymaps | ||
| prints | ||
| script | ||
| .gitignore | ||
| LICENSE | ||
| MANIFEST.in | ||
| README.md | ||
| readthedocs.yml | ||
| requirements.txt | ||
| setup.py | ||
README.md
prettymaps
A minimal Python library to draw customized maps from OpenStreetMap data.
Based on osmnx, matplotlib, shapely and vsketch libraries.
Important:
![]()
- I've made the
plotfunction print by default a message in the corner containing the mandatory OpenStreetMap credit and the link to this repository. Please keep it. - You can make commercial use of
prettymapsdrawings, but I ask that you credit OpenStreetMaps and myself. - Share your creations on the prettymaps subreddit
As seen on Hacker News:

Read the docs
Google Colaboratory Demo
![]()
Installation
Install with
$ pip install prettymaps
Usage example (For more examples, see this Jupyter Notebook):
# Init matplotlib figure
fig, ax = plt.subplots(figsize = (12, 12), constrained_layout = True)

backup = plot(
    # Address:
    'Praça Ferreira do Amaral, Macau',
    # Plot geometries in a circle of radius:
    radius = 1100,
    # Matplotlib axis
    ax = ax,
    # Which OpenStreetMap layers to plot and their parameters:
    layers = {
            # Perimeter (in this case, a circle)
            'perimeter': {},
            # Streets and their widths
            'streets': {
                'width': {
                    'motorway': 5,
                    'trunk': 5,
                    'primary': 4.5,
                    'secondary': 4,
                    'tertiary': 3.5,
                    'residential': 3,
                    'service': 2,
                    'unclassified': 2,
                    'pedestrian': 2,
                    'footway': 1,
                }
            },
            # Other layers:
            #   Specify a name (for example, 'building') and which OpenStreetMap tags to fetch
            'building': {'tags': {'building': True, 'landuse': 'construction'}, 'union': False},
            'water': {'tags': {'natural': ['water', 'bay']}},
            'green': {'tags': {'landuse': 'grass', 'natural': ['island', 'wood'], 'leisure': 'park'}},
            'forest': {'tags': {'landuse': 'forest'}},
            'parking': {'tags': {'amenity': 'parking', 'highway': 'pedestrian', 'man_made': 'pier'}}
        },
        # drawing_kwargs:
        #   Reference a name previously defined in the 'layers' argument and specify matplotlib parameters to draw it
        drawing_kwargs = {
            'background': {'fc': '#F2F4CB', 'ec': '#dadbc1', 'hatch': 'ooo...', 'zorder': -1},
            'perimeter': {'fc': '#F2F4CB', 'ec': '#dadbc1', 'lw': 0, 'hatch': 'ooo...',  'zorder': 0},
            'green': {'fc': '#D0F1BF', 'ec': '#2F3737', 'lw': 1, 'zorder': 1},
            'forest': {'fc': '#64B96A', 'ec': '#2F3737', 'lw': 1, 'zorder': 1},
            'water': {'fc': '#a1e3ff', 'ec': '#2F3737', 'hatch': 'ooo...', 'hatch_c': '#85c9e6', 'lw': 1, 'zorder': 2},
            'parking': {'fc': '#F2F4CB', 'ec': '#2F3737', 'lw': 1, 'zorder': 3},
            'streets': {'fc': '#2F3737', 'ec': '#475657', 'alpha': 1, 'lw': 0, 'zorder': 3},
            'building': {'palette': ['#FFC857', '#E9724C', '#C5283D'], 'ec': '#2F3737', 'lw': .5, 'zorder': 4},
        }
)
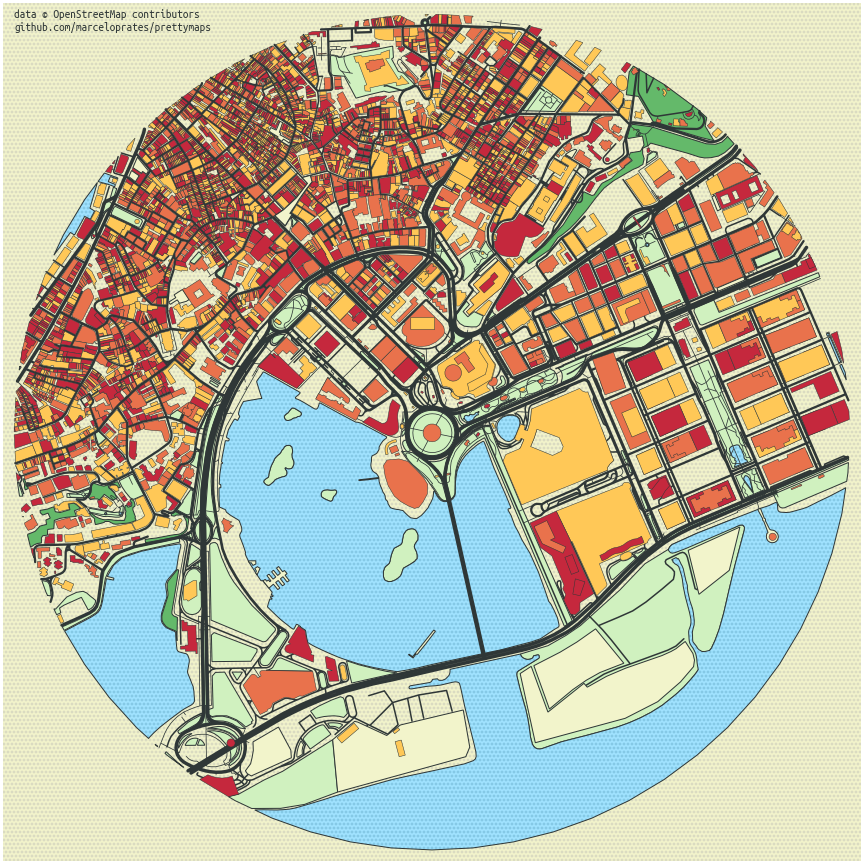
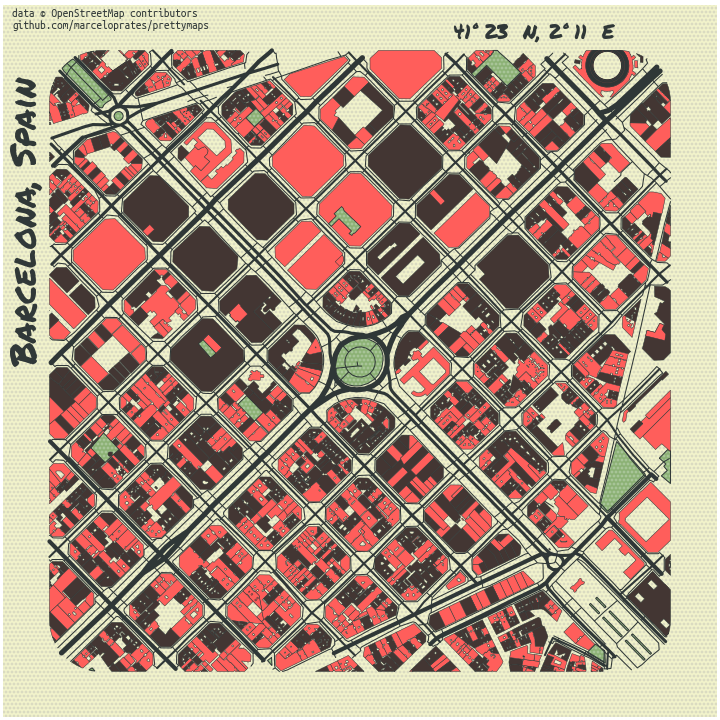
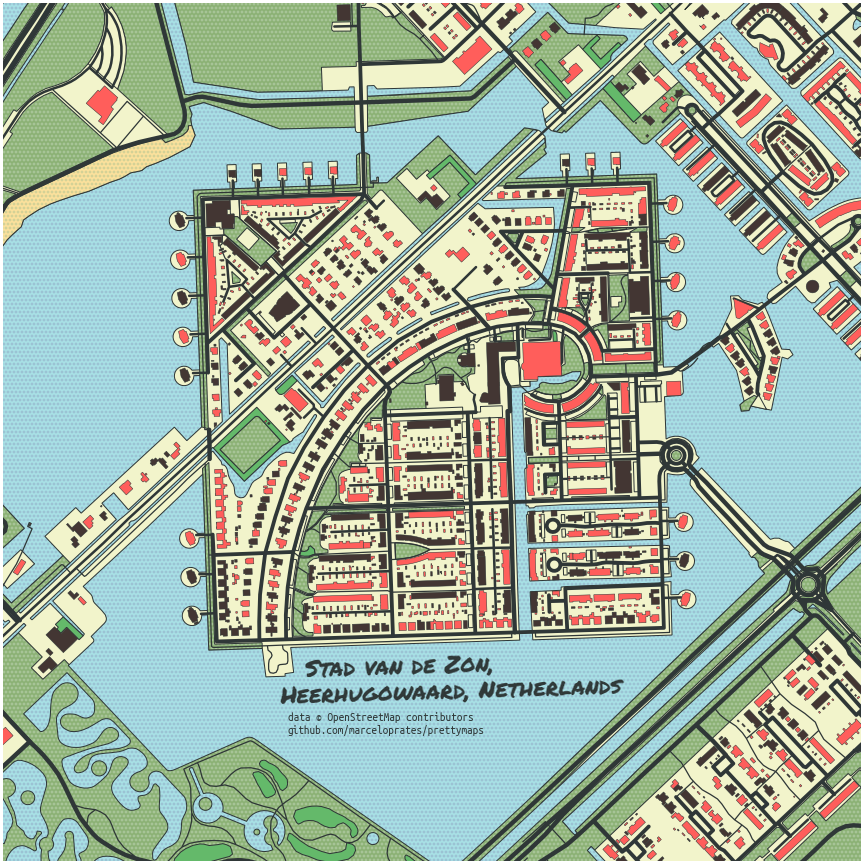
Gallery:
Barcelona:
Heerhugowaard:
Barra da Tijuca:

Porto Alegre:
