kopia lustrzana https://github.com/marceloprates/prettymaps
|
|
||
|---|---|---|
| .devcontainer | ||
| .github | ||
| assets/Permanent_Marker | ||
| docs | ||
| etc | ||
| notebooks | ||
| prettymaps | ||
| prints | ||
| script | ||
| .gitignore | ||
| LICENSE | ||
| MANIFEST.in | ||
| README.md | ||
| readthedocs.yml | ||
| requirements.txt | ||
| setup.py | ||
README.md
prettymaps
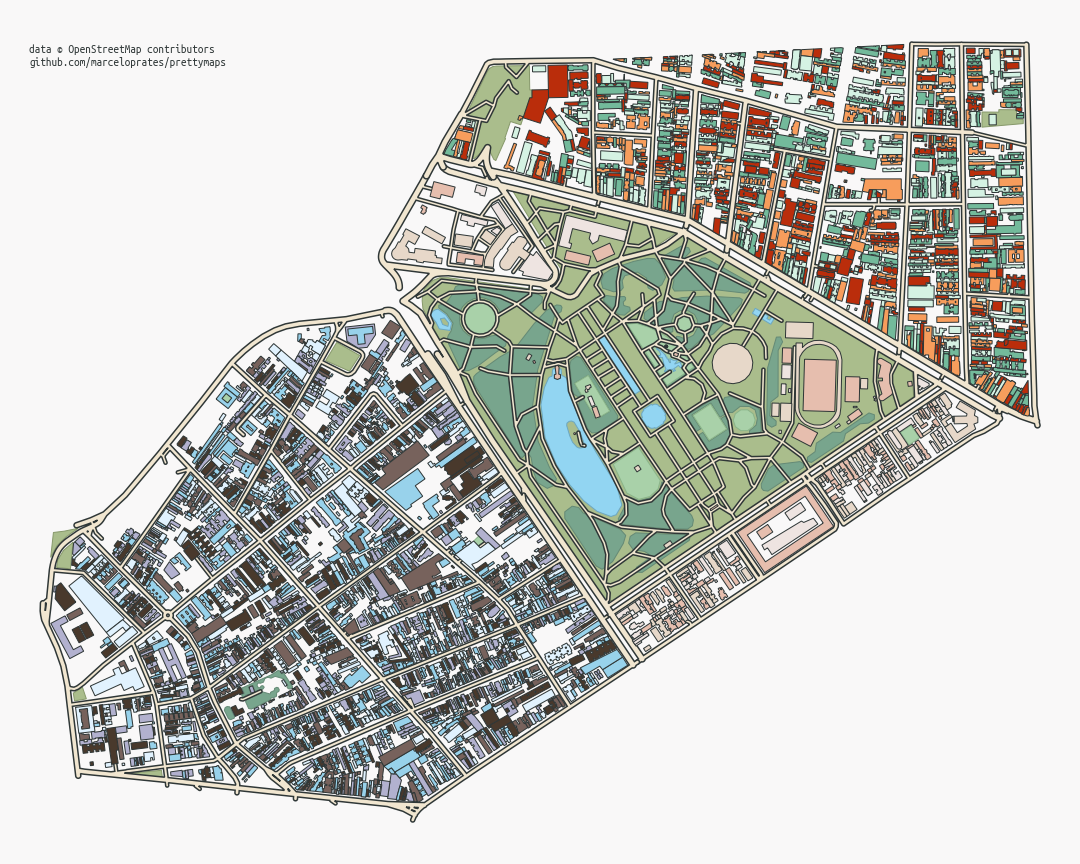
A minimal Python library to draw customized maps from OpenStreetMap created using the osmnx, matplotlib, shapely and vsketch libraries.
This work is licensed under a GNU Affero General Public License v3.0:
- You can make commercial use, distribute and modificate this project, but must disclose the source code with the license and copyright notice.
Note about NFTs:
- I am personally against NFTs for their environmental impact, the fact that they're a giant money-laundering pyramid scheme and the structural incentives they create for theft in the open source and generative art communities.
- I do not authorize in any way this project to be used for selling NFTs, although I have no legal way of enforcing my intent. Respect the creator.
- The AeternaCivitas and geoartnft projects have used this work to sell NFTs and refused to credit it. See how they reacted after being exposed: AeternaCivitas, geoartnft.
- I have closed my other generative art projects on Github and won't be sharing new ones as open source to protect me from the NFT community.
Note about crediting:
- Please keep the printed message on the figures crediting OpenStreetMap and my repository (The OSM credit is mandatory by their license).
- CREDIT OPEN SOURCE DEVELOPERS!
![]()
As seen on Hacker News:

Read the docs
prettymaps subreddit
Google Colaboratory Demo
Installation
Install with
$ pip install prettymaps
Usage example (For more examples, see this Jupyter Notebook):
# Init matplotlib figure
fig, ax = plt.subplots(figsize = (12, 12), constrained_layout = True)
backup = plot(
# Address:
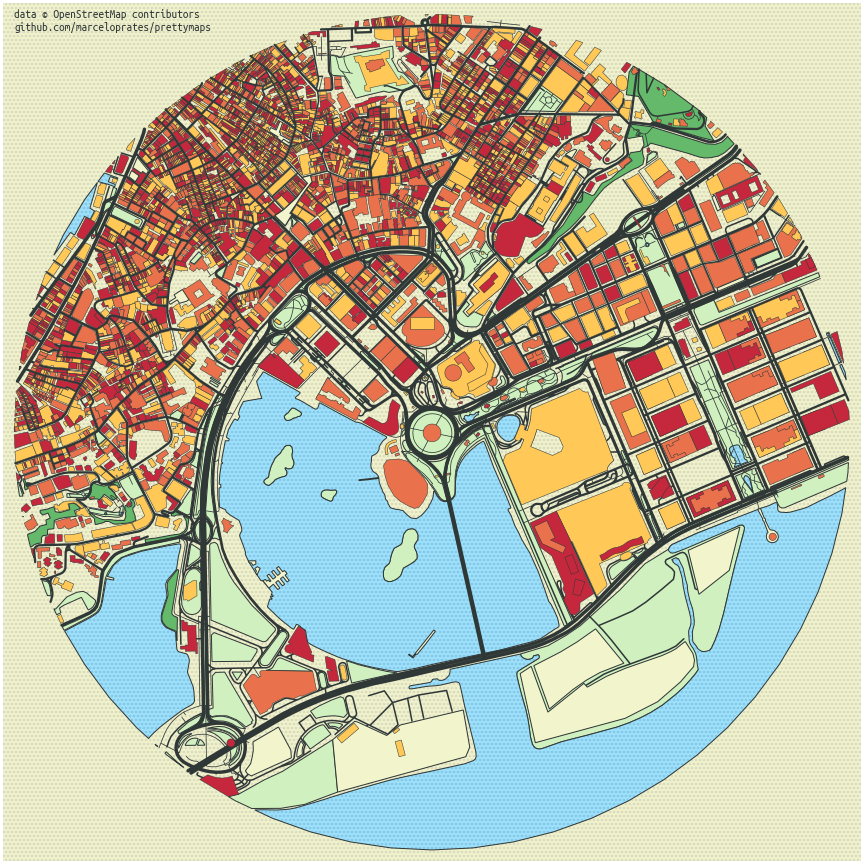
'Praça Ferreira do Amaral, Macau',
# Plot geometries in a circle of radius:
radius = 1100,
# Matplotlib axis
ax = ax,
# Which OpenStreetMap layers to plot and their parameters:
layers = {
# Perimeter (in this case, a circle)
'perimeter': {},
# Streets and their widths
'streets': {
'width': {
'motorway': 5,
'trunk': 5,
'primary': 4.5,
'secondary': 4,
'tertiary': 3.5,
'residential': 3,
'service': 2,
'unclassified': 2,
'pedestrian': 2,
'footway': 1,
}
},
# Other layers:
# Specify a name (for example, 'building') and which OpenStreetMap tags to fetch
'building': {'tags': {'building': True, 'landuse': 'construction'}, 'union': False},
'water': {'tags': {'natural': ['water', 'bay']}},
'green': {'tags': {'landuse': 'grass', 'natural': ['island', 'wood'], 'leisure': 'park'}},
'forest': {'tags': {'landuse': 'forest'}},
'parking': {'tags': {'amenity': 'parking', 'highway': 'pedestrian', 'man_made': 'pier'}}
},
# drawing_kwargs:
# Reference a name previously defined in the 'layers' argument and specify matplotlib parameters to draw it
drawing_kwargs = {
'background': {'fc': '#F2F4CB', 'ec': '#dadbc1', 'hatch': 'ooo...', 'zorder': -1},
'perimeter': {'fc': '#F2F4CB', 'ec': '#dadbc1', 'lw': 0, 'hatch': 'ooo...', 'zorder': 0},
'green': {'fc': '#D0F1BF', 'ec': '#2F3737', 'lw': 1, 'zorder': 1},
'forest': {'fc': '#64B96A', 'ec': '#2F3737', 'lw': 1, 'zorder': 1},
'water': {'fc': '#a1e3ff', 'ec': '#2F3737', 'hatch': 'ooo...', 'hatch_c': '#85c9e6', 'lw': 1, 'zorder': 2},
'parking': {'fc': '#F2F4CB', 'ec': '#2F3737', 'lw': 1, 'zorder': 3},
'streets': {'fc': '#2F3737', 'ec': '#475657', 'alpha': 1, 'lw': 0, 'zorder': 3},
'building': {'palette': ['#FFC857', '#E9724C', '#C5283D'], 'ec': '#2F3737', 'lw': .5, 'zorder': 4},
}
)
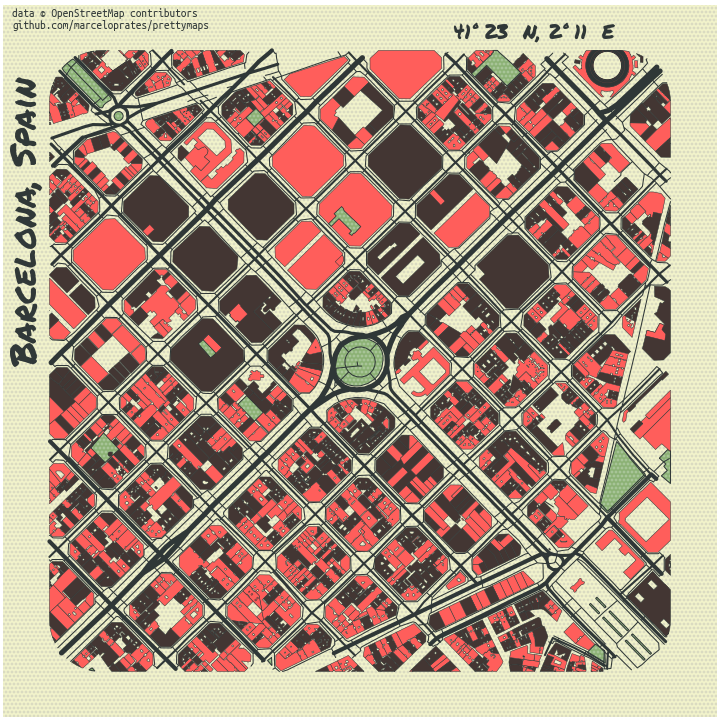
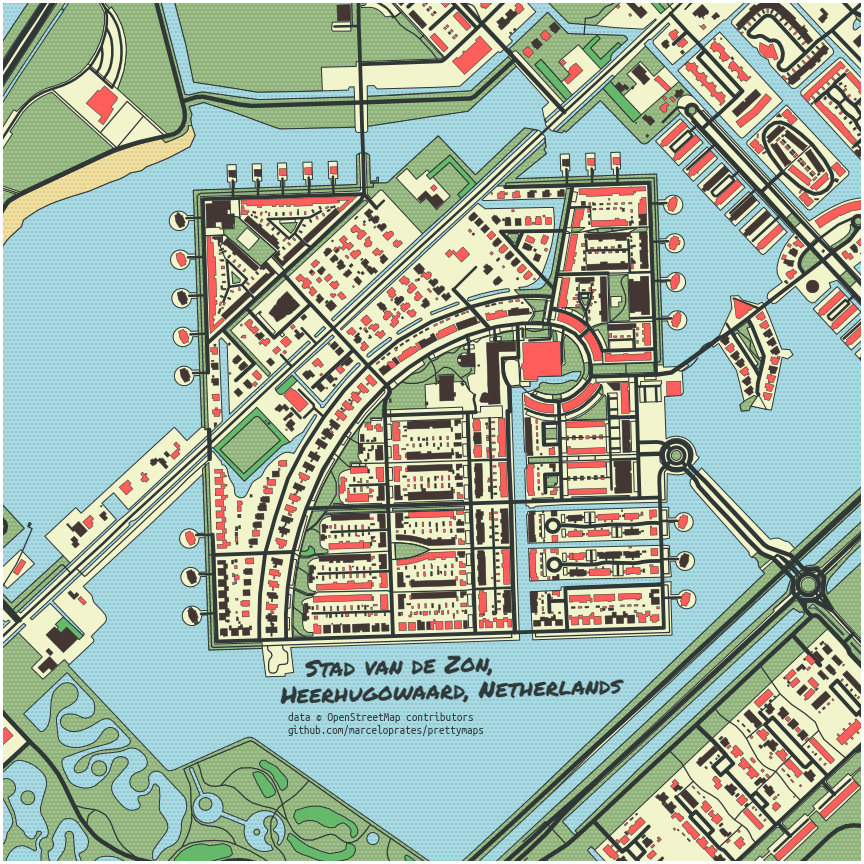
Gallery:
Barcelona:
Heerhugowaard:
Barra da Tijuca:
Porto Alegre: