2.9 KiB
PID Tuning Using Ziegler-Nicols
This uses the Ziegler Nicols method to estimate values for the Kp/Ki/Kd PID control values.
The method implemented here is taken from "Ziegler–Nichols Tuning Method" by Vishakha Vijay Patel
One issue with Ziegler Nicols is that is a heuristic: it generally works quite well, but it might not be the optimal values. Further manual adjustment may be necessary.
Process Overview
- First of all, you will record a temperature profile for your kiln.
- Next, we use those figures to estimate Kp/Ki/Kd.
Step 1: Record Temperature Profie
Ensure kiln-controller is stopped during profile recording: The profile must be recorded without any interference from the actual PID control loop (you also don't want two things changing the same GPIOs at the same time!)
Make sure your kiln is completely cool - we need to record the data starting from room temperature to correctly measure the effect of kiln/heating.
There needs to be no abnormal source of temperature change to the kiln: eg if you normally run with a kiln plug in place - make sure its in place for the test!
To record the profile, run:
python kiln-tuner.py recordprofile zn.csv
The above will drive your kiln to 400 and record the temperature profile to the file zn.csv. The file will look something like this:
time,temperature
4.025461912,45.5407078
6.035358906,45.5407078
8.045399904,45.5407078
10.05544925,45.59087846
...
Step 2: Compute the PID parameters
Once you have your zn.csv profile, run the following:
python kiln-tuner.py zn zn.csv
The values will be output to stdout, for example:
Kp: 3.853985144980333 1/Ki: 87.78173053095107 Kd: 325.9599328488931
(Note that the Ki value is already inverted ready for use in config)
Sanity checking the results
If you run
python kiln-tuner.py zn zn.csv --showplot
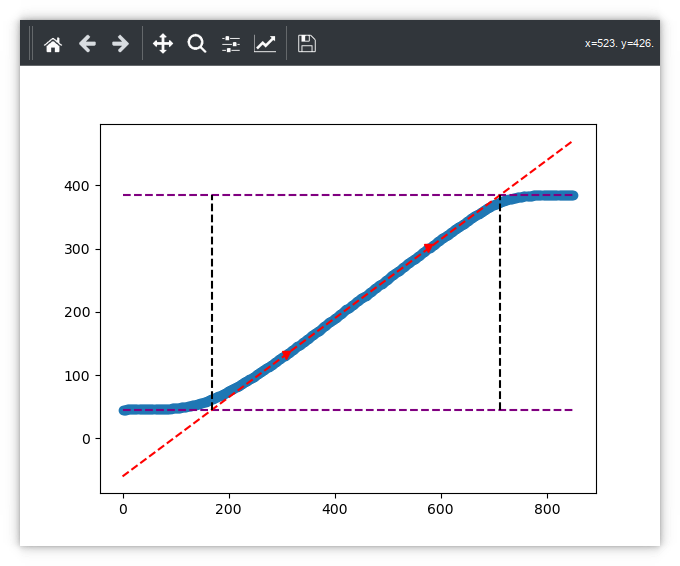
It will display a plot of the parameters. It should look simular to this  .
.
Note: you will need python's pyplot installed for this to work.
The smooth linear part of the chart is very important. If it is too short, try increasing the target temperature (see later).
The red diagonal line: this must follow the smooth part of your chart closely.
My diagonal line isn't right
You might need to adjust the line parameters to make it fit your data properly. You can do this as follows:
python kiln-tuner.py zn zn.csv --tangentdivisor 4
tangentdivisor modifies which parts of the profile is used to calculate the line.
It is a floating point number >= 2; If necessary, try varying it till you get a better fit.
Changing the target temperature
By default it is 400. You can change this as follows:
python kiln-tuner.py recordprofile zn.csv --targettemp 500
(where the target temperature has been changed to 500 in the example above)