kopia lustrzana https://github.com/RobertGawron/IonizationChamber
35 wiersze
1.2 KiB
Markdown
35 wiersze
1.2 KiB
Markdown
|
|
# Purpose
|
||
|
|
|
||
|
|
This is a set of scripts that take .csv files and generate diagrams for easy analysis of measurements.
|
||
|
|
|
||
|
|
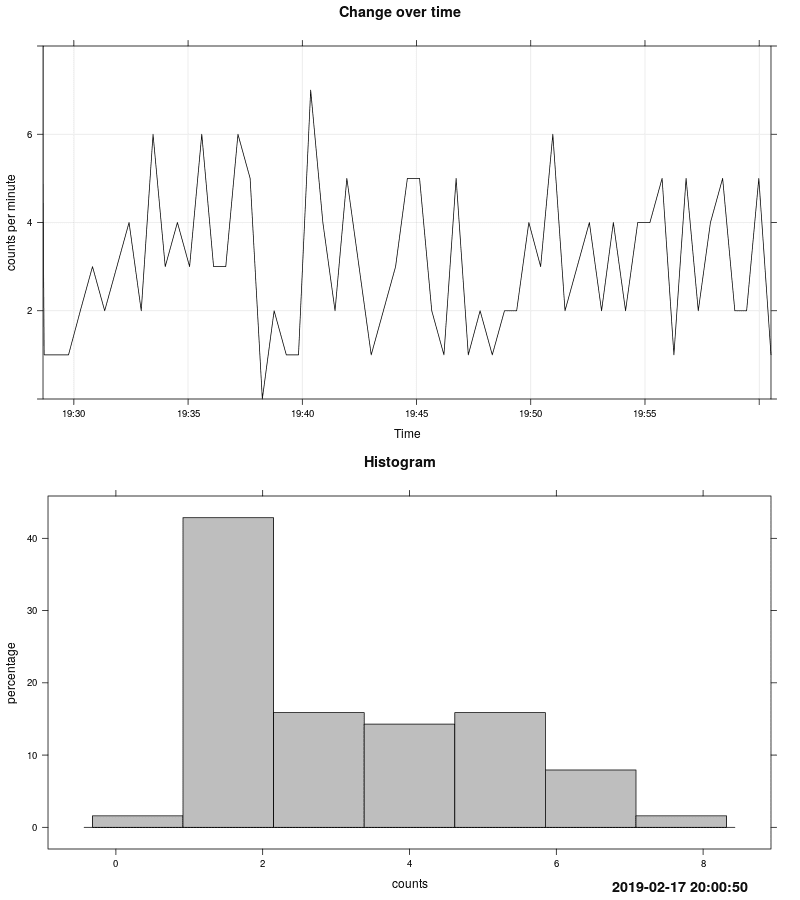
# Plotting Signal Value in Time Domain + Plotting Histogram
|
||
|
|
|
||
|
|
This mode is useful for observing measurement changes over time.
|
||
|
|
|
||
|
|
After collecting data, run the script to post-process it and generate diagrams:
|
||
|
|
|
||
|
|
Rscript main.R
|
||
|
|
|
||
|
|
A new .png image with a timestamp in its name will be created in the directory where the script is located.
|
||
|
|
|
||
|
|
Below is an example of such a generated plot.
|
||
|
|
|
||
|
|
|
||
|
|
|
||
|
|
|
||
|
|
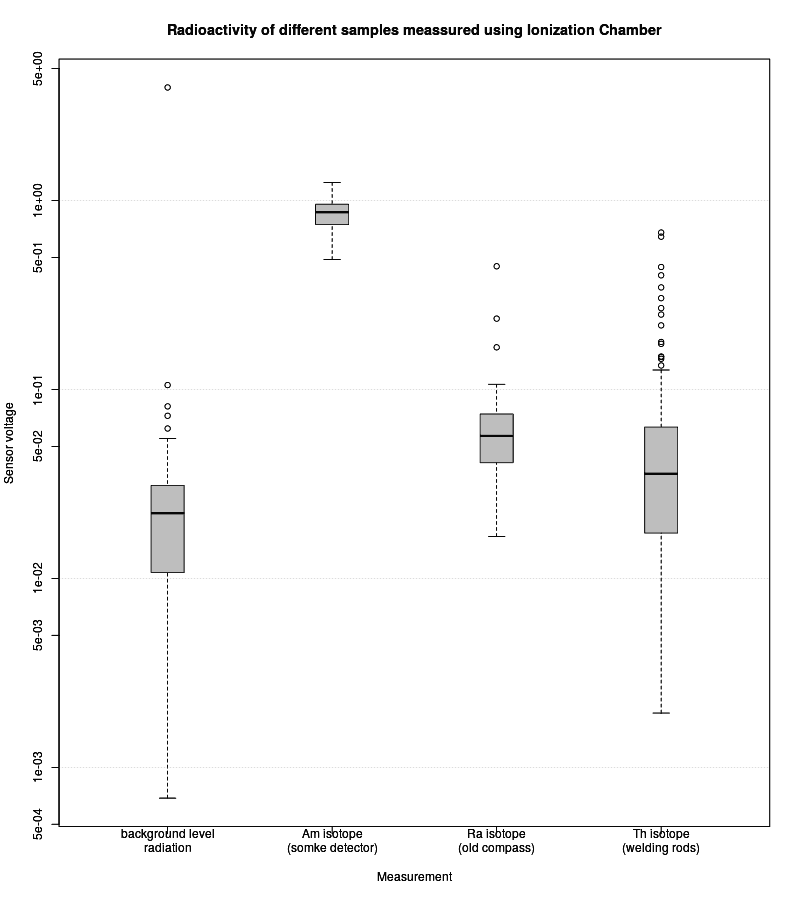
# Plotting Values from Different Measurements [(box plot)](https://en.wikipedia.org/wiki/Box_plot)
|
||
|
|
|
||
|
|
Collect data from different samples as separate .csv files.
|
||
|
|
|
||
|
|
Edit boxplot.R to match the filenames of the .csv files and the labels of the measurements.
|
||
|
|
|
||
|
|
Run:
|
||
|
|
|
||
|
|
Rscript boxplot.R
|
||
|
|
|
||
|
|
A new .png image with a timestamp in its name will be created in the directory where the script is located.
|
||
|
|
|
||
|
|
Below is an example of such a generated plot.
|
||
|
|
|
||
|
|
|